
Desktop client
Nested RAID 60 across groups
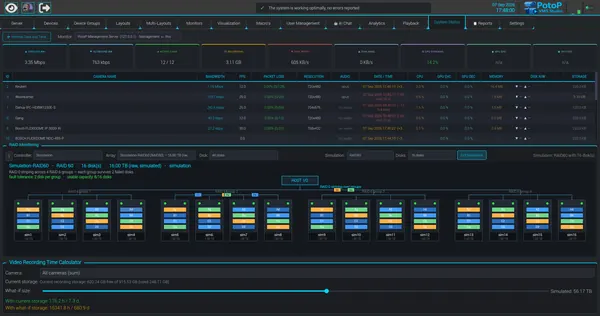
RAID 60 stripes over several RAID 6 groups, and the diagram shows how each group tolerates its own disk failures. The calculator underneath translates the resulting capacity into recording time.
How it works
The same RAID monitor can draw nested levels. Here a simulated RAID 60 of sixteen disks is shown as four RAID 6 groups, with striping across the groups on top. The panel works out fault tolerance per group, so each group survives two failed disks, and usable capacity as eight of sixteen disks. The what-if slider below feeds that capacity into the recording time calculator, which divides it by the measured camera bitrate. Planning is done on the server data without changing any disks.