PotoP VMS Studio

Professional Video Management System

One system for live video, recording, AI detection, floor plans and control-room walls — with its own certificate authority, failover to a standby server and a desktop, web and Android client.

Made in the EU Runs on your own servers

Detections drawn on recordings

Video walls

Multi-monitor layouts, identified screens and one-click projection from any client.

Playback that finds things

Event timeline, detections on recordings, TimeFold synopsis and encrypted, watermarked export.

AI on your own hardware

Object, pose, segmentation, plate and face analysis with cross-camera search — no cloud.

Live floor plans

Cameras, doors, lights and intercoms on your plans with live state and view cones.

Failover & RAID

A standby server takes over automatically; RAID health and capacity are always in view.

Secure by default

Own certificate authority, HTTPS to cameras, fine-grained permissions, 2FA and a full audit trail.

Built for serious video operations

PotoP VMS Studio runs your cameras from one server and shows them wherever you need them: a multi-monitor control room, a browser, or a phone. Recording, playback, AI analysis and alarm handling live in the same system, so an event on a camera becomes a marked moment on the timeline, a notification and — if you want — a macro that acts on it.

It is made for installers and operators who have to trust it at 3 a.m.: a standby server takes over when the primary fails, storage health is always in view, every action is audited, and every connection is encrypted with certificates the system issues itself.

Even better with PotoP Enterprise Suite

PotoP VMS Studio is complete on its own. Installers and service companies who also run PotoP Enterprise Suite get their engineering and service work done faster.

PotoP Enterprise Suite

Faults go straight to service

An operator reports a failure in the VMS; it becomes a service call in PES with an SLA clock, and the operator sees when an engineer is on the way.

Programmed from the design

Cameras, recording, AI analysis, schedules and workstation layouts drawn in PES are pushed to the server in one step.

Documentation that stays true

The installed system can be read back into PES, so drawings, packages and certificates match reality.

Feature tour

Every screen below is a real screenshot. Search for a feature or pick a chapter; click a picture to see it full size and page through them with the arrow keys.

01

Monitors & video walls 5 screens

Put any mix of cameras on any number of screens, and send a layout to a wall with one click.

Multi-layout video walls
Highlight Desktop client

Multi-layout video walls

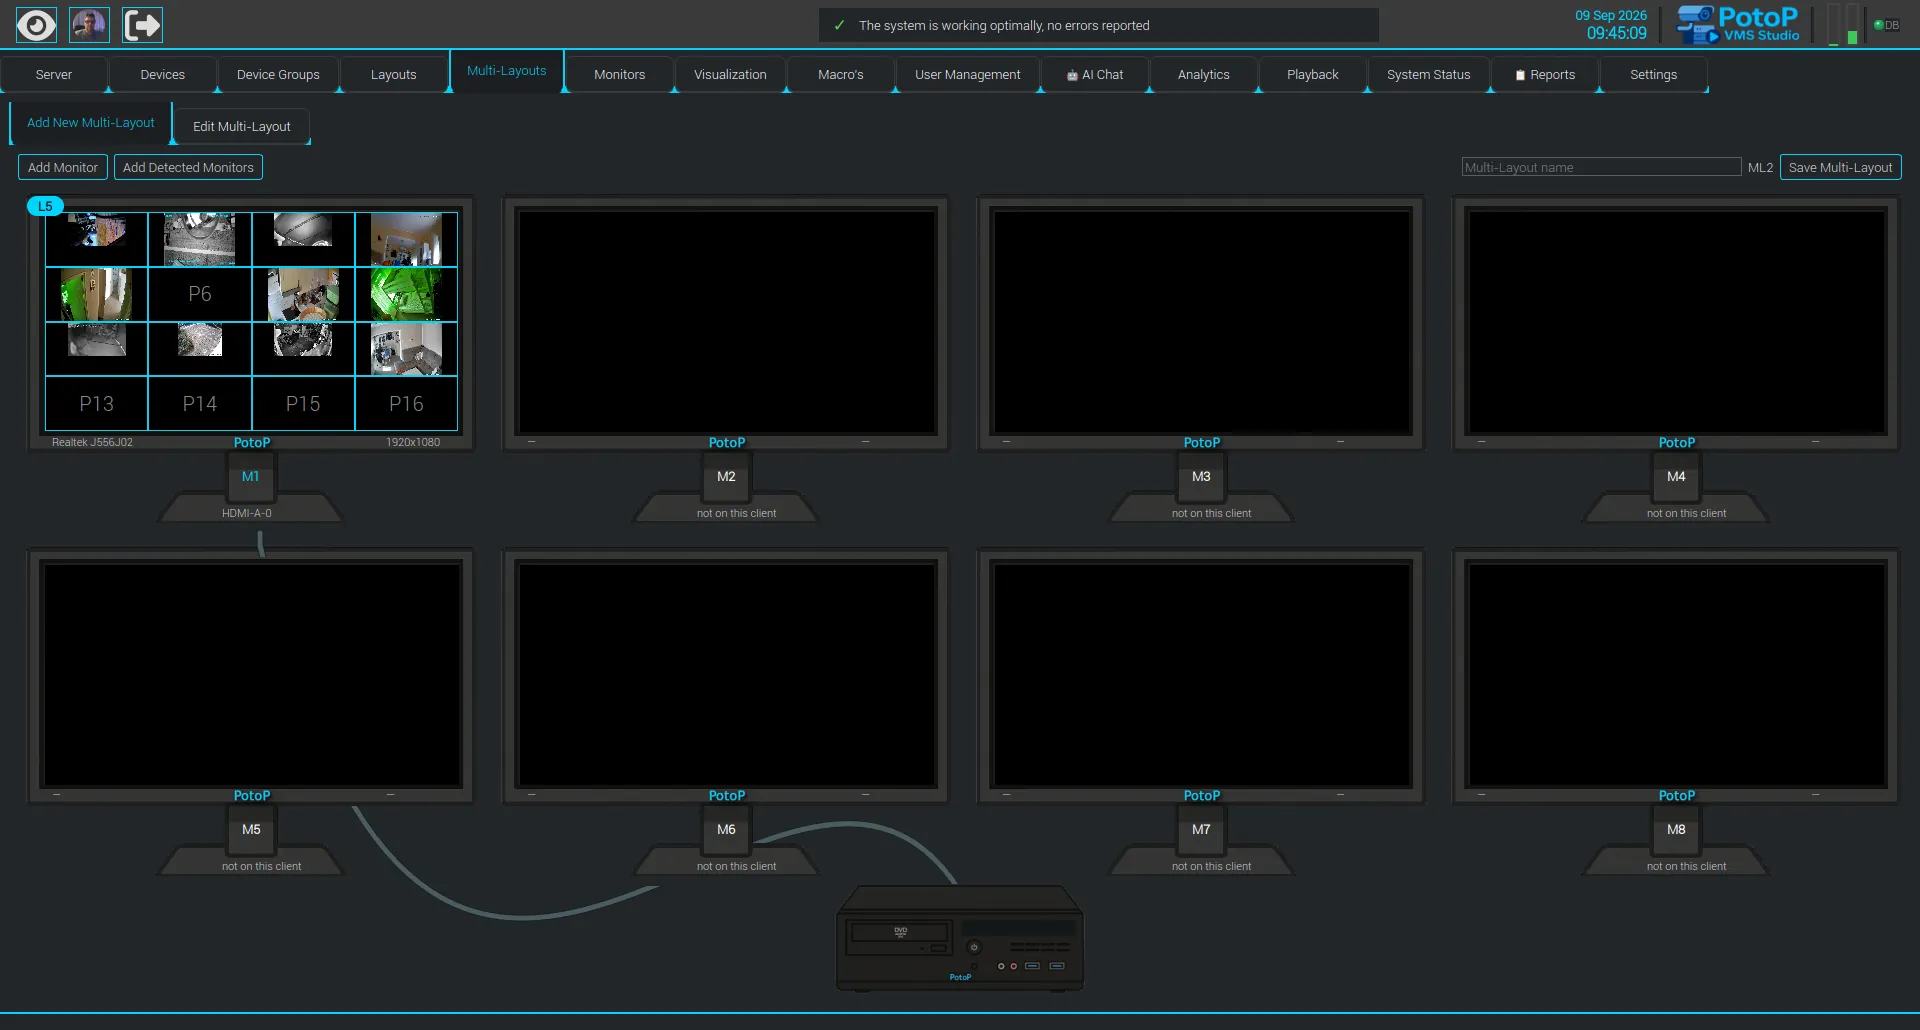
A multi-layout places a camera layout on each monitor of a control room in one recipe. Monitors that are not present on the client are simply skipped, so the same wall works on a two-screen desk or a large room.

How it works

A multi-layout is a saved recipe on the server: for each monitor code it stores which camera layout to show. On launch, the client looks up which of those codes exist on this machine, opens a full-screen window on each one and loads the matching layout with its live streams. Codes that are not present are skipped, so the same recipe runs on a two-screen desk or a larger room. Layouts keep their camera assignments, and the recipe can be assigned to users or groups so it opens automatically at sign-in.

Every screen, recognised
Desktop client

Every screen, recognised

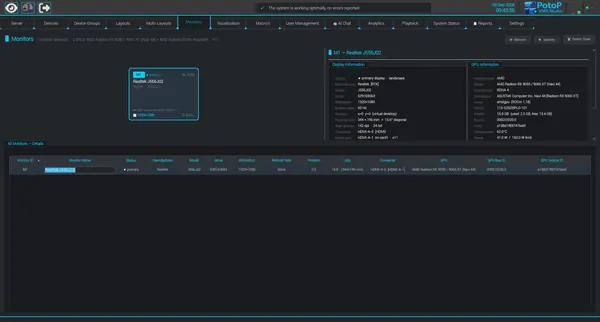
The Monitors tab lists each display attached to the client with its port, resolution, refresh rate and graphics card. Every monitor keeps a permanent code such as M1, so a wall always lands on the same physical screen.

How it works

The client asks the operating system for its displays and the graphics driver for details, so each monitor shows manufacturer, model, serial, resolution, refresh rate, connector and the GPU that drives it, plus temperature and VRAM where the driver reports them. Each physical screen is matched by hardware identity, not by position, and is given a permanent code such as M1. Renames and codes are stored on that client and survive reboots and re-plugging. A monitor that is unplugged stays listed until you delete it, so a saved wall still points to the same screen.
Build a wall in the browser
Web client

Build a wall in the browser

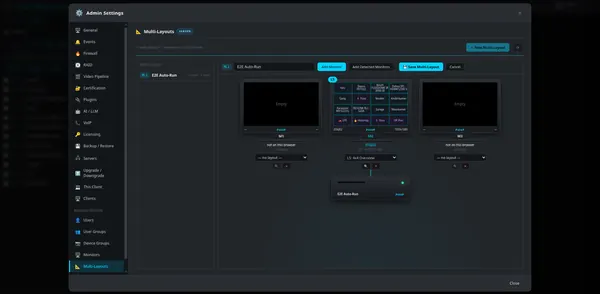
The web client offers the same wall editor under Admin Settings. Pick a layout for each monitor code, save the multi-layout, and project it to the screens of the browser you are sitting at.

How it works

The editor runs in the browser and saves the multi-layout to the server, so the same recipe is shared with desktop clients. The browser lists its own screens through the Window Management API, which needs a secure HTTPS connection and the user's permission. Each entry shows a monitor code, and codes that are not on this browser are shown as not present. Choosing a layout for a code adds it to the recipe. Projecting opens one browser window per matching screen and places it there, each running the live layout.

One click to project a wall
Web client

One click to project a wall

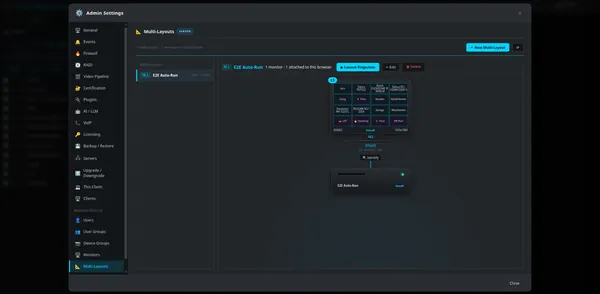
A saved multi-layout shows its monitors and layouts at a glance, with buttons to launch the projection, edit or delete it. Walls can also be assigned to users and groups so they open automatically.

How it works

Multi-layouts are stored on the server as a list of monitor codes with the layout for each. This overview draws every recipe as a small picture of its screens and shows how many of them exist on the browser you use. Launch Projection opens a window on each matching screen and starts the live layouts there. Edit and Delete change the stored recipe for all clients. Access follows the same user and group rights as the rest of the system, and a wall can be attached to users or groups so it opens for them automatically.

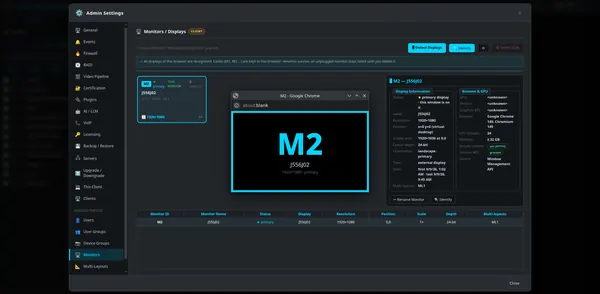
Identify each display
Web client

Identify each display

In the web client, Identify flashes the monitor code and name full screen on every display the browser can see. In a room full of identical screens you always know which physical monitor is M2. The desktop client has the same function on its Monitors tab.

How it works

The browser can tell which physical screen each window sits on through the Window Management API, which requires HTTPS and a one-time permission prompt. Identify opens a borderless window on every detected display and draws the monitor code and name in large type, then closes it after a few seconds. The code comes from a registry kept in this browser, so renames survive and an unplugged monitor stays listed until you delete it. The details panel reports resolution, position, scale and colour depth as the browser sees them.

02

Playback & recording 7 screens

Find the moment that matters: events on the timeline, AI boxes on the video, and exports that prove they are untouched.

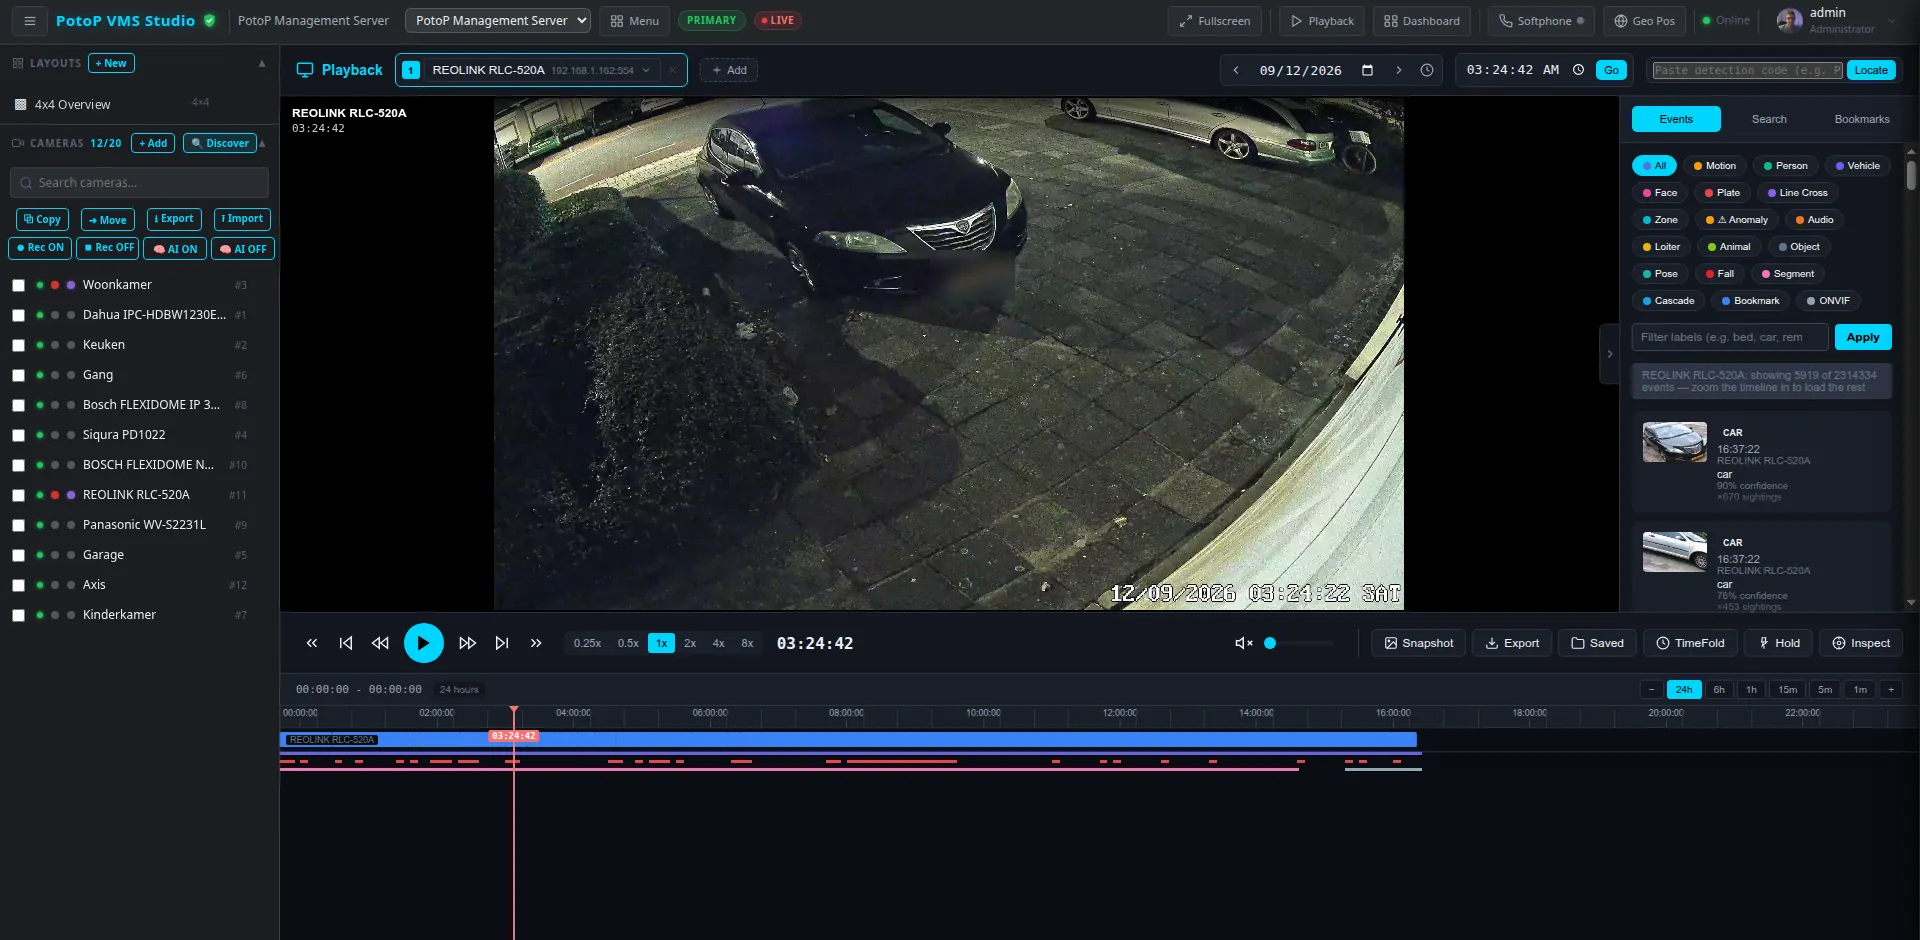
Playback with event timeline
Highlight Web client

Playback with event timeline

Pick a camera and a date, and the timeline shows recorded periods with motion and detection marks. The event panel lists detected cars, people and more with thumbnails, so you jump straight to what matters.

How it works

Recordings are stored as time-stamped segments on the server. When you pick a camera, a single WebSocket channel pushes the list of recorded periods and the stream of detection events, so the timeline fills without polling. Events come from the analytics database, where the AI pipeline wrote every motion, person, vehicle and plate detection with a thumbnail. The filter chips narrow the list by type. The server decrypts segments in memory when needed and serves the video to the browser. Clicking an event moves the playhead to that moment.

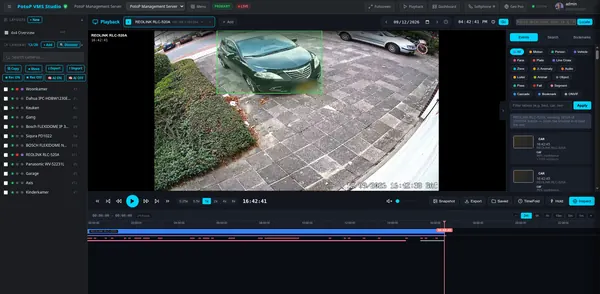
Detections drawn on recordings
Web client

Detections drawn on recordings

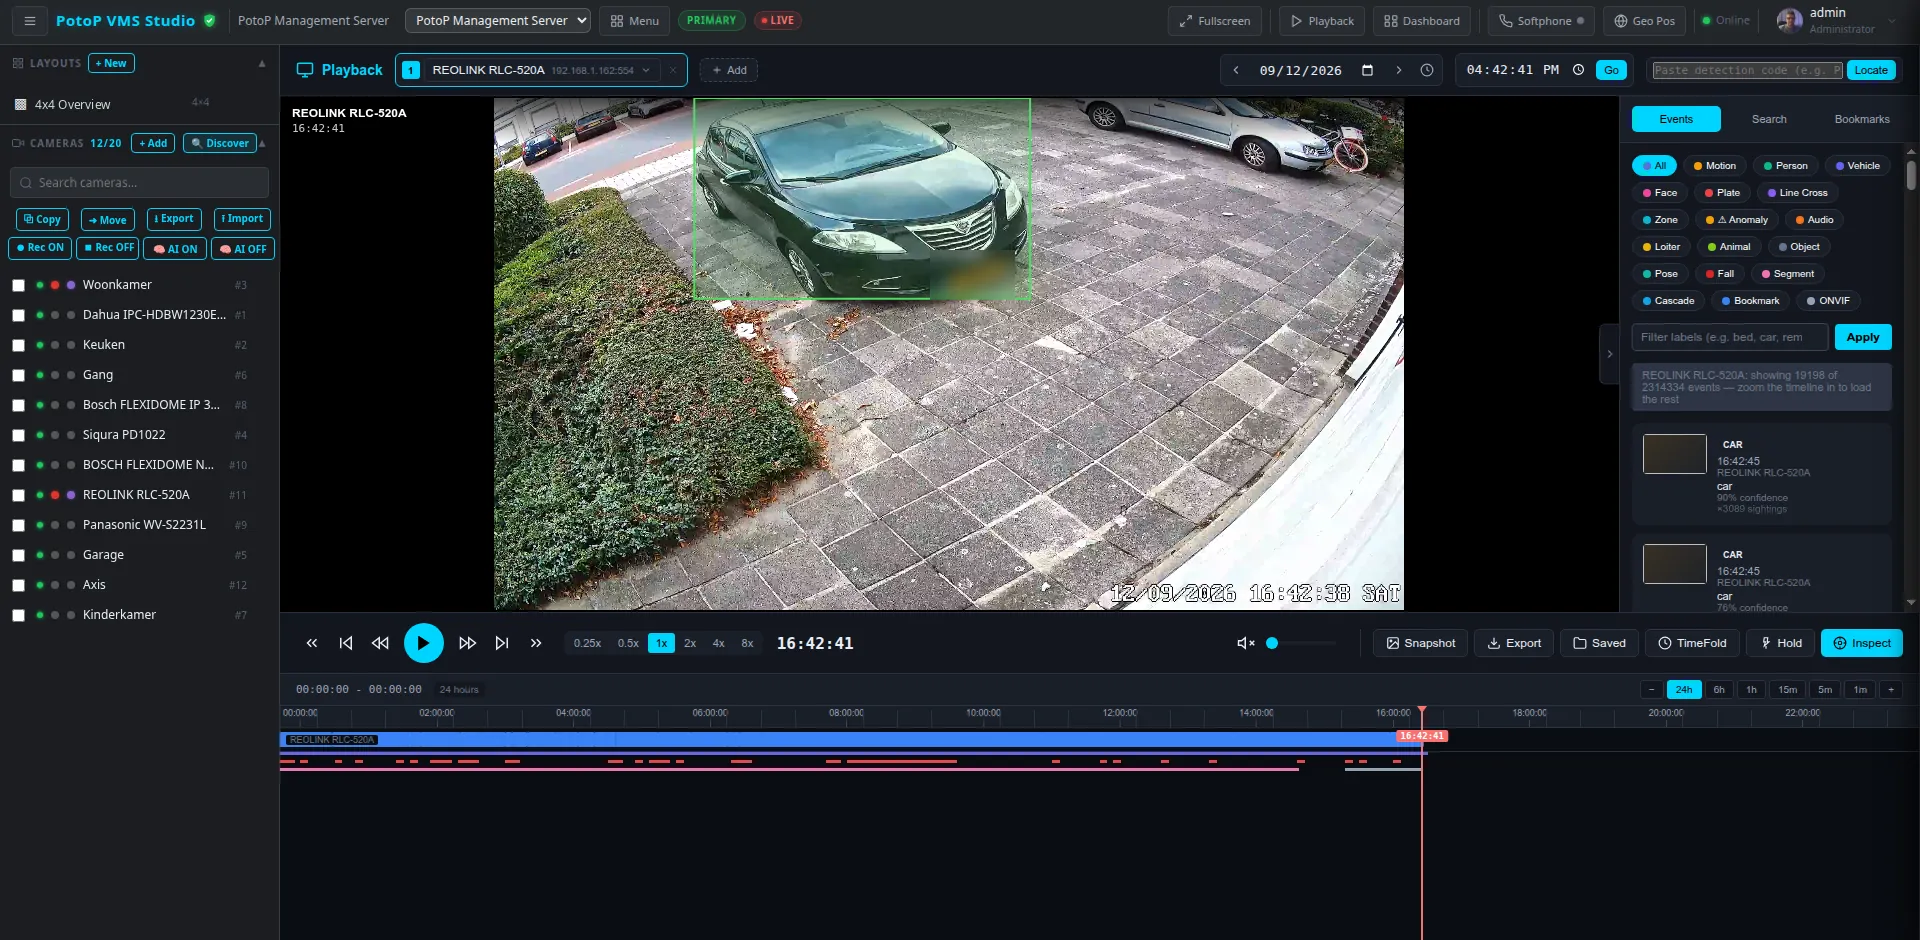
Recorded video plays with the detected object outlined, and the side list shows the class and confidence of each detection. Investigators find the vehicle or person they need without scrubbing through hours of footage.

How it works

While the AI pipeline watched the live stream, it stored each detection with its class, confidence, bounding box and a thumbnail in the analytics database. Playback reads those rows for the moment being shown and draws the box over the video in the browser, so nothing is burned into the recording. The side list is fed by the same rows and shows class, time and confidence. Clicking an entry seeks the recording to that instant. The tracker also counts how many sightings belong to one object, which helps separate one parked car from many passing ones.

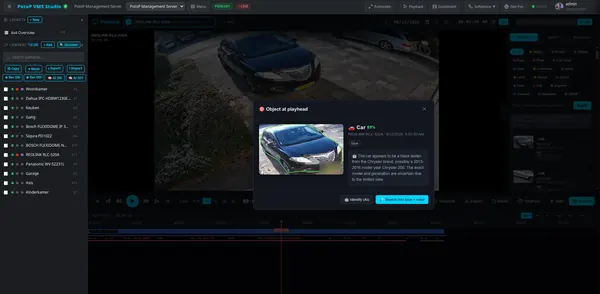
Identify an object at playhead
Web client

Identify an object at playhead

Pause on any frame and inspect the object under the playhead. The assistant describes what it sees, and one button searches the recordings for the same type and colour.

How it works

Inspect takes the frame under the playhead and sends it to the server, which runs the detector on it and cuts out the object with its mask. The Identify button passes that crop to a vision language model configured in the AI settings, running locally or through a provider you choose, and shows its description. Colour comes from the crop itself. Search this type and colour then queries the analytics database for detections of the same class and colour across the recordings. The description is a model's best guess, and it says so when the view is poor.

TimeFold video synopsis
Web client

TimeFold video synopsis

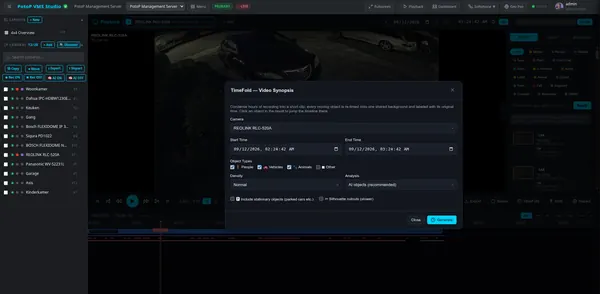
TimeFold condenses hours of recording into a short clip by overlaying moving objects on one shared background. Choose the time range, object types and density, then generate the summary.

How it works

The server walks the recorded segments for the chosen range, decrypting them in memory, and samples frames. A background-subtraction gate skips empty frames, so the object detector and tracker only run where something moves. Each tracked object becomes a tube of cropped frames with its original timestamps. Tubes are rescheduled to play at the same time over one shared background, and ffmpeg renders the result as an MP4 with each object's real time burned in. The job runs in the background with progress polling and can be cancelled. Clicking an object jumps the timeline to its original moment.

Encrypted, watermarked export
Web client

Encrypted, watermarked export

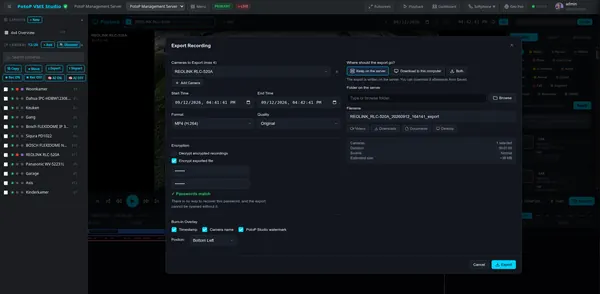
Export a time range to the server or to your own computer as MP4, with optional AES encryption and a burned-in timestamp, camera name and watermark. The recipient needs the password, so evidence stays protected.

How it works

The server cuts the requested time range from the recorded segments with ffmpeg, decrypting encrypted recordings in memory if you ask. Timestamp, camera name and watermark are burned into the picture. If you enable encryption, the MP4 is encrypted with AES-256 using a key derived from your password by PBKDF2, and a signature file is written beside it. The password is never stored, so nothing can recover it. The result stays on the server, downloads to your computer, or both, depending on the destination you choose.

Standalone player for exports
Standalone player

Standalone player for exports

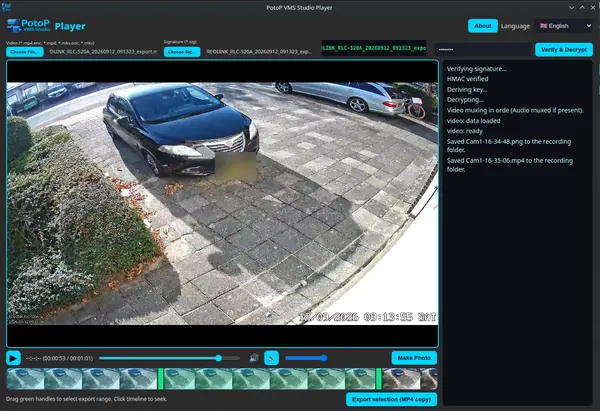
The PotoP Player opens encrypted exports, verifies the signature and decrypts them with the password. You can then trim a selection, take a photo or export an MP4 copy.

How it works

The player runs on any computer without a PotoP server. You choose the encrypted video and its signature file, and enter the password. It first checks the signature with an HMAC to prove the file is unchanged, then derives the key from the password with PBKDF2 and decrypts with AES-256. The clear video exists only in memory while it plays. From there you can drag the green handles to trim a selection, save a still picture, or export a plain MP4 copy. A browser-based variant ships inside export folders with launchers for Linux, Windows and macOS.

Recording rules per camera
Web client

Recording rules per camera

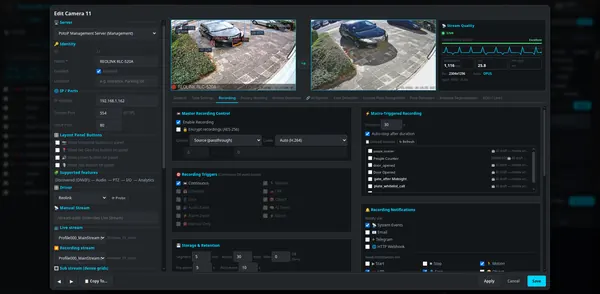
Set continuous, scheduled or event-triggered recording per camera, with encryption, storage and retention options. Macros and notifications can react to the recording events.

How it works

Each camera has its own recording settings stored on the server, and the recorder applies them as soon as you save. Triggers can be continuous, a weekly schedule, or events such as motion, person, plate, an alarm input or a macro, with pre-event and post-event buffers so the moment before the trigger is kept. Segments are cut at a set length and can be encrypted with AES-256 after they are closed. Retention removes old segments by age or by maximum size. Start, stop and detection events can raise notifications through system events, email, Telegram or a webhook.

03

AI detection 7 screens

Detection runs on your own server and GPU or AI accelerator. Build the pipeline per camera: what to look for, where, and when to raise an alarm.

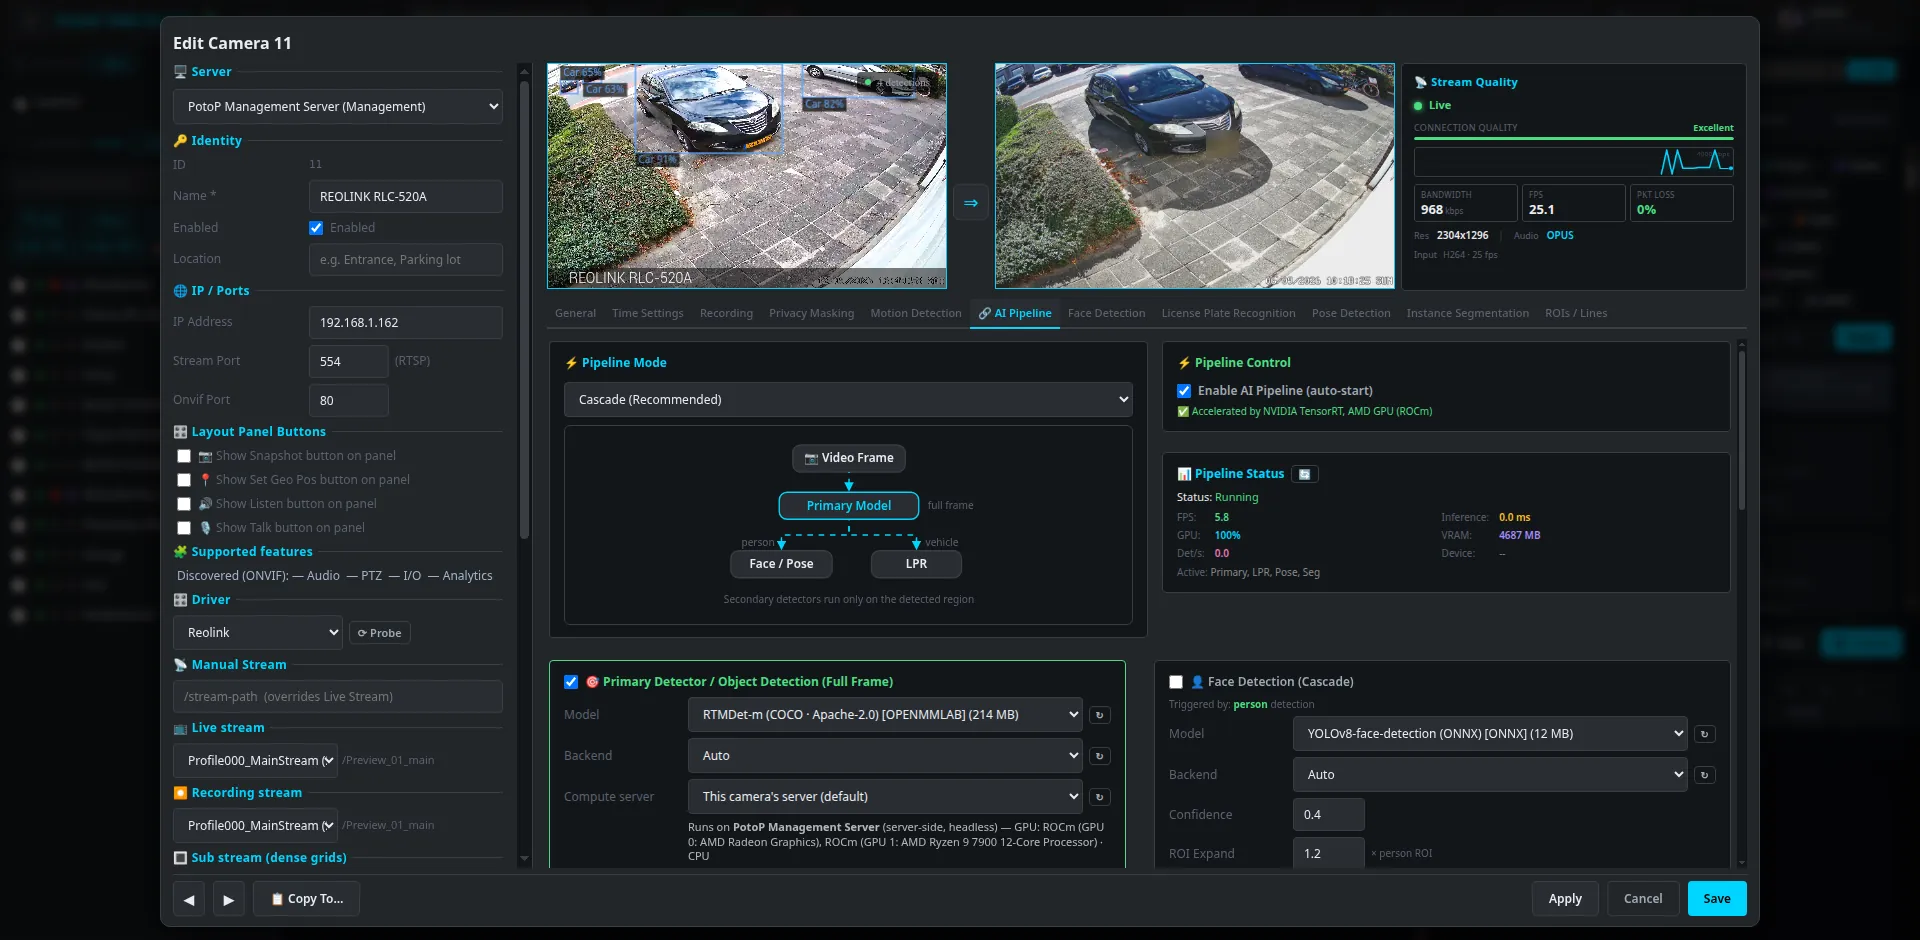
Configurable AI pipeline
Highlight Web client

Configurable AI pipeline

Each camera gets its own AI pipeline. A primary detector can feed cascaded stages for faces, plates and pose, with the model, backend and compute device selectable per stage.

How it works

The AI runs on the server, not in the browser. For each camera the server starts a pipeline that decodes the stream and runs a primary detector on the full frame. The cascade then sends only the detected region to secondary models: faces and pose for a person, licence plates for a vehicle. Every stage has its own model, backend and compute device. Backends include ONNX Runtime, OpenVINO, TensorRT and ROCm, so NVIDIA, AMD, Intel and CPU all work. Stages can run on another server in the cluster. Results are written to the analytics database.

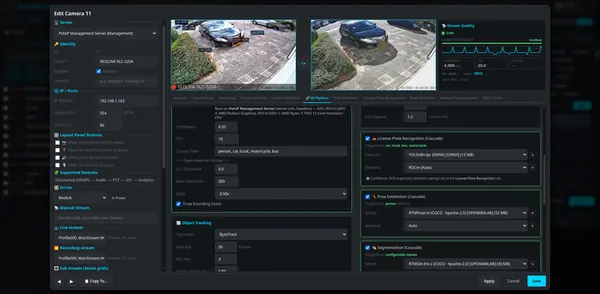
Cascade stages and tracking
Web client

Cascade stages and tracking

Detection thresholds, class filters and object tracking are set per camera. Licence plate, pose estimation and segmentation stages run only when the earlier stage finds the object they need.

How it works

The primary detector runs at a configured frame rate with its own confidence, overlap threshold, maximum detections and class filter. A tracker, ByteTrack in this view, links detections across frames into stable object IDs, which drives counting and dwell time. Secondary stages are gated by class: plate recognition starts only when a car, truck, bus or motorcycle is found, and pose or segmentation only when their trigger class appears. That keeps the load low, because the heavier models see a small crop and not the whole frame.

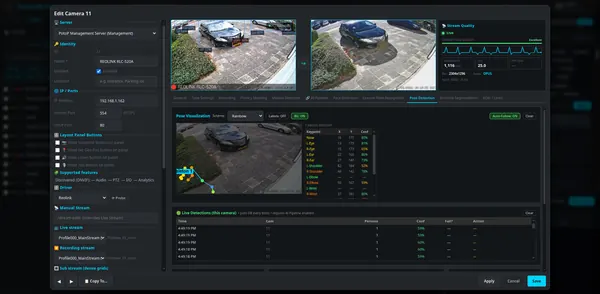
Pose and fall detection
Web client

Pose and fall detection

Skeleton keypoints are drawn on the live image with a table of joint positions and confidence. A live table logs persons and fall events for the camera.

How it works

A pose model runs on the person crop found by the primary detector and returns body keypoints with a confidence for each one. The server stores the skeleton and the browser draws it over the image, with the joint table beside it. Fall detection looks at how those keypoints move and are arranged over time, and a sensitivity setting adjusts its thresholds. When it triggers, the event is stored and can raise an alert or start a macro. The live table below polls the database, so you see the same rows that reach the alarm system.

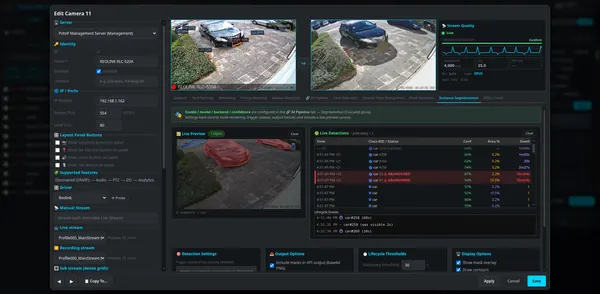
Instance segmentation
Web client

Instance segmentation

Objects are outlined with pixel-accurate masks, and the live table tracks each object with its dwell time. Stationary or abandoned objects are highlighted in red.

How it works

A segmentation model runs on the objects found by the primary detector and returns a pixel mask for each one. The server sends these to the browser as mask images, and the preview paints them over the frame. The tracker keeps an object ID, so the table can show how long each object has been in view. When an object stays still longer than the stationary threshold, the lifecycle logic marks it as abandoned and the row turns red. Lifecycle events, such as appeared or left, are logged for later search.

Zones and line crossing
Web client

Zones and line crossing

Draw regions and lines directly on the camera image to define zones of interest. Line crossing and zone events can then count people and vehicles or trigger alarms.

How it works

You draw polygons and lines directly on a live picture, and the server saves them in the camera's normalised coordinates, so they stay correct at any resolution. The tracker follows object IDs, and a crossing is detected when a tracked object's position moves from one side of the line to the other, giving the direction A to B or B to A. Zones raise entry and dwell events. Each event goes to the analytics database with a timestamp and track ID, where counters, reports, alarms and macros can use it.

Motion masks
Web client

Motion masks

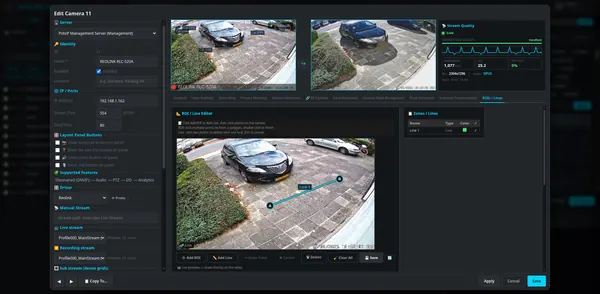
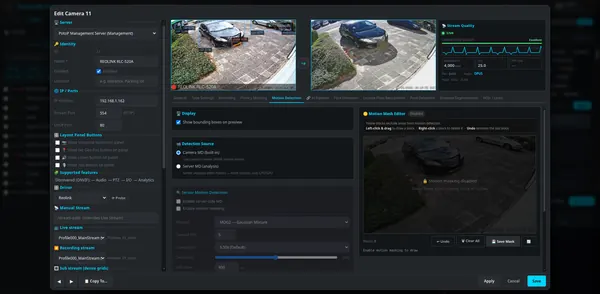
Paint the areas that must be ignored, such as trees or a busy road, so motion detection only reacts to what matters. Server-side analysis or the camera's own motion detection can be used as the source.

How it works

Motion detection has two sources. The camera's own detection arrives as ONVIF motion events, and server analysis compares video frames with a background model on the server, using CPU or GPU. The mask is a grid of blocks you paint on the picture, and blocks marked as ignored are excluded from the comparison, so leaves or road traffic do not trigger. Sensitivity, minimum area, sampling rate and downscale can be tuned. The mask is saved with the camera and applied by the server as soon as you save.

Privacy masking
Web client

Privacy masking

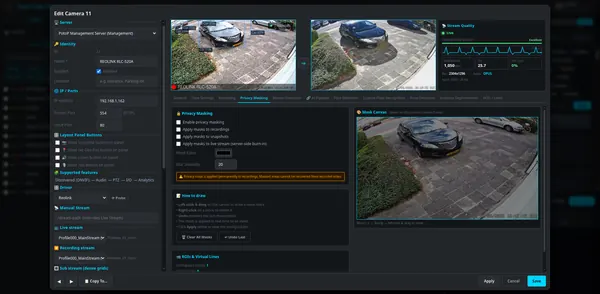
Draw masks on the camera image to hide areas such as neighbouring windows. The mask can be applied to the live view, snapshots and recordings.

How it works

You draw blocks on a live frame, and the server saves them with the camera. Depending on the switches, the server blurs or covers those areas in the live stream, in snapshots and in recordings. For live and recordings it does this on the server, before the video is stored or sent out, and for recordings the masked area is permanently lost from the stored video, which the page warns about. Colour and blur strength are adjustable. The masks are pushed to the running pipeline on save, so the change applies without restarting the camera.

04

Analytics 4 screens

Search everything the AI has seen, follow a person across cameras and count what passes by.

Search every detection
Highlight Desktop client

Search every detection

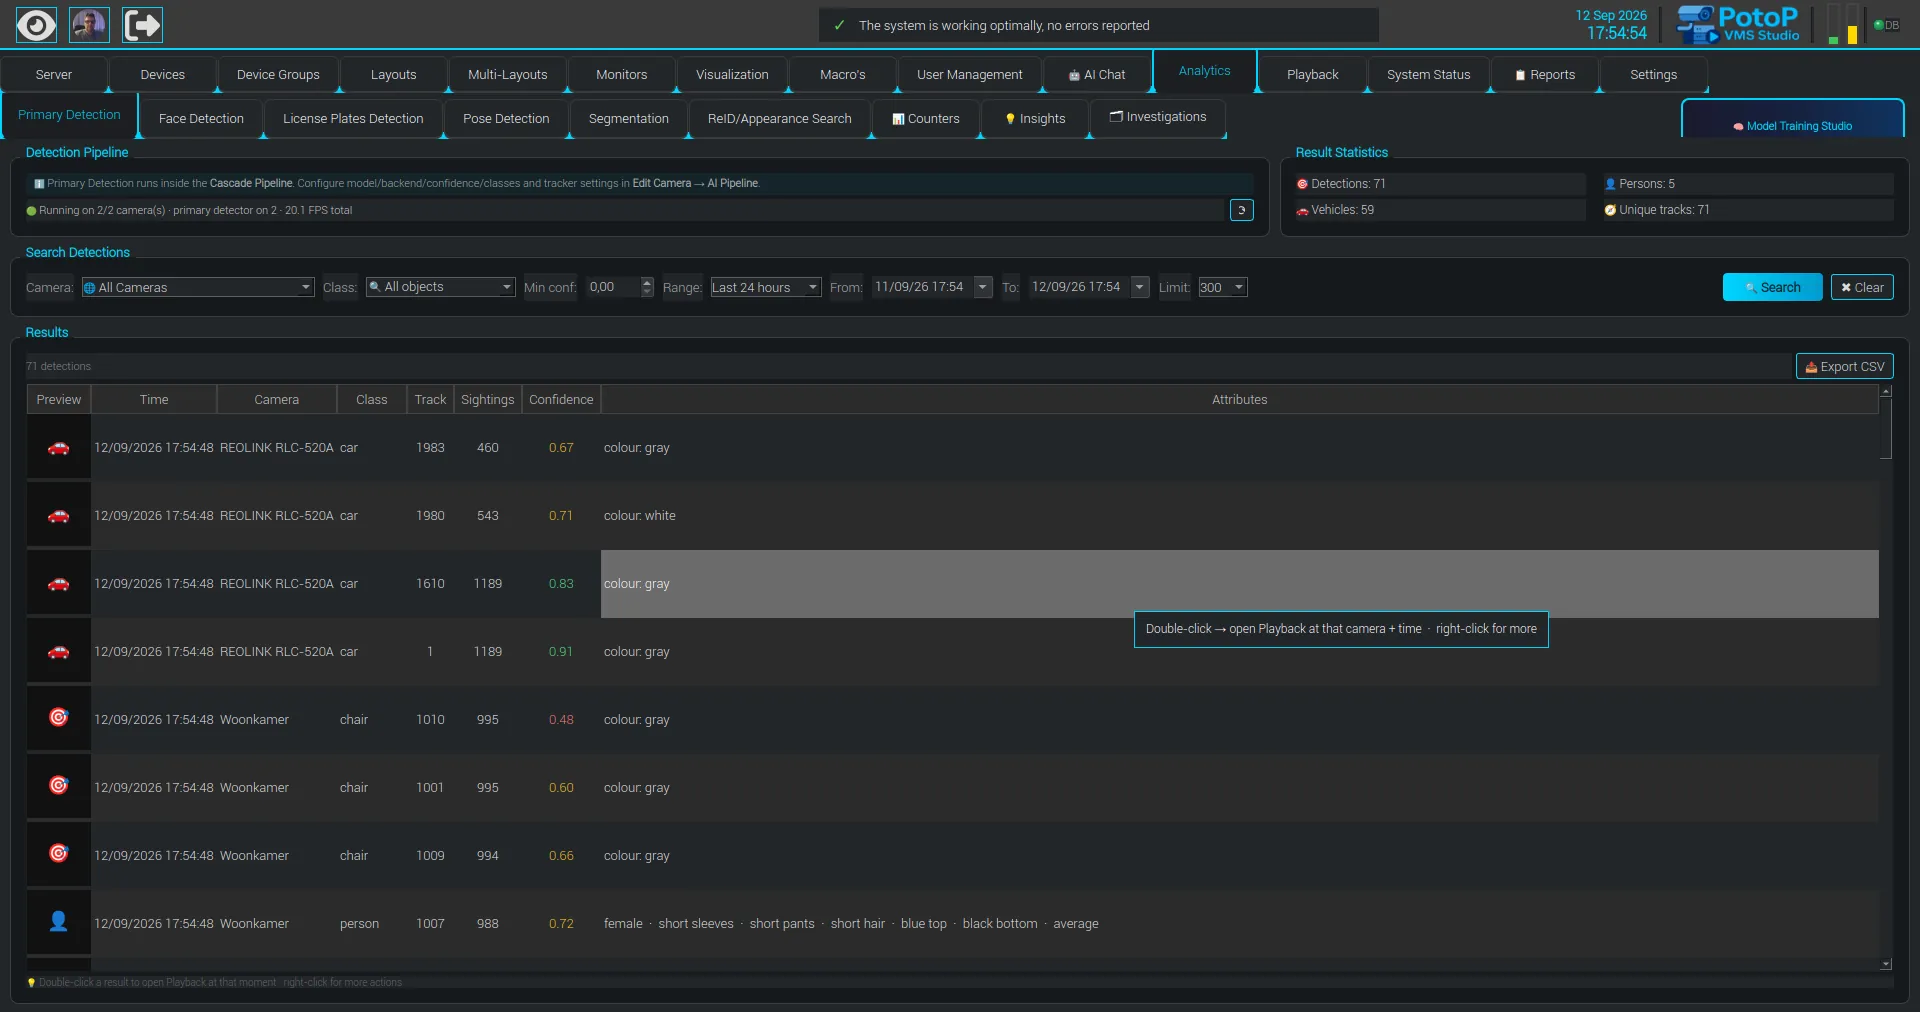
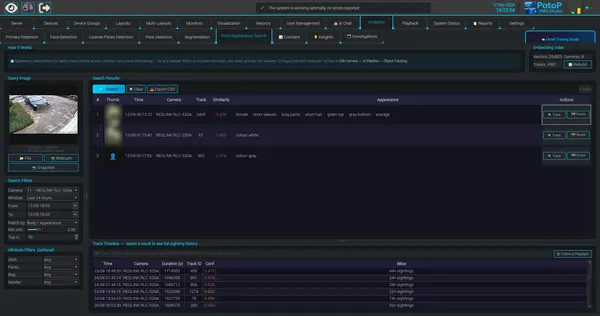
Search objects detected by every camera, filtered by camera, class, confidence and time. Results carry attributes such as colour and clothing, and a double-click opens Playback at that exact moment. Export the list to CSV for further work.

How it works

Every detection produced by the AI pipeline is written to the analytics database with camera, class, confidence, time, a track ID and attributes. The search screen runs a filtered query against that database, so it answers in one step across all cameras. Attributes such as colour, clothing and hair are derived by classifying the object's crop at detection time. Double-clicking a row opens Playback at that camera and time. The Export CSV button writes the current result list to a file, and the statistics box counts persons, vehicles and unique tracks.

Follow a person across cameras
Desktop client

Follow a person across cameras

Appearance search finds the same person or vehicle on other cameras using visual embeddings, without needing a face. Select a result to load its route and sighting history, then follow it in Playback.

How it works

Each person or vehicle crop is turned into a 256-value appearance vector by a small re-identification model running on OpenVINO, and stored in the analytics database. Searching embeds the query picture the same way and compares it with the stored vectors by cosine similarity, using an in-memory index so the result is exact and quick. Because it matches overall appearance and not a face, it works on people seen from behind or at low resolution. Selecting a result loads that track's sighting history and route, and Follow in Playback opens the recordings.

People and vehicle counters
Desktop client

People and vehicle counters

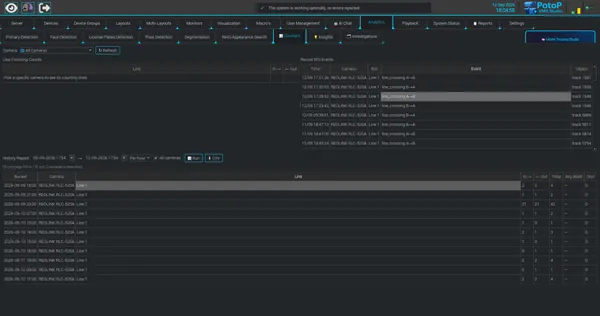
Line-crossing counters record how many objects pass in each direction. The history report groups crossings per hour with totals, and exports to CSV for staffing and occupancy studies.

How it works

When a tracked object crosses a configured line, the server records the event with its direction, camera, line and time. This screen reads those events live in the Recent list. The history report groups them into buckets per hour or per day, with in, out and total columns, and can add dwell time and occupancy where those are configured. Occupancy limits raise an alert when breached. The CSV button exports the report for spreadsheets, which is how staffing and occupancy studies are usually done.

Daily digest for operators
Web client

Daily digest for operators

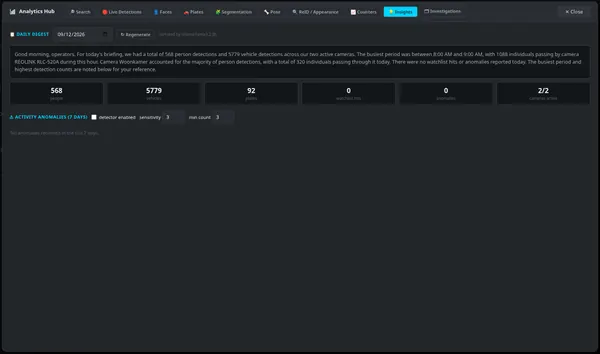
A plain-language briefing summarises the day: people, vehicles and plates detected, watchlist hits and active cameras. A local language model writes the text, and an anomaly detector flags unusual activity.

How it works

The server counts detections per camera and hour from the analytics data, including plates and watchlist hits. Those figures are given to a language model, here a small Llama model served locally by Ollama, which writes the briefing in plain language. If no model is available, a plain statistical summary is shown instead. The anomaly detector uses no AI model: it learns a typical count for each hour of the day, separately for weekdays and weekends, and flags an hour far above that baseline. It stays quiet until enough history exists.

05

Visualization 9 screens

Draw your site once and watch it live: cameras with their view cones, doors, lights and intercoms with their real state.

Cameras with field of view
Highlight Desktop client

Cameras with field of view

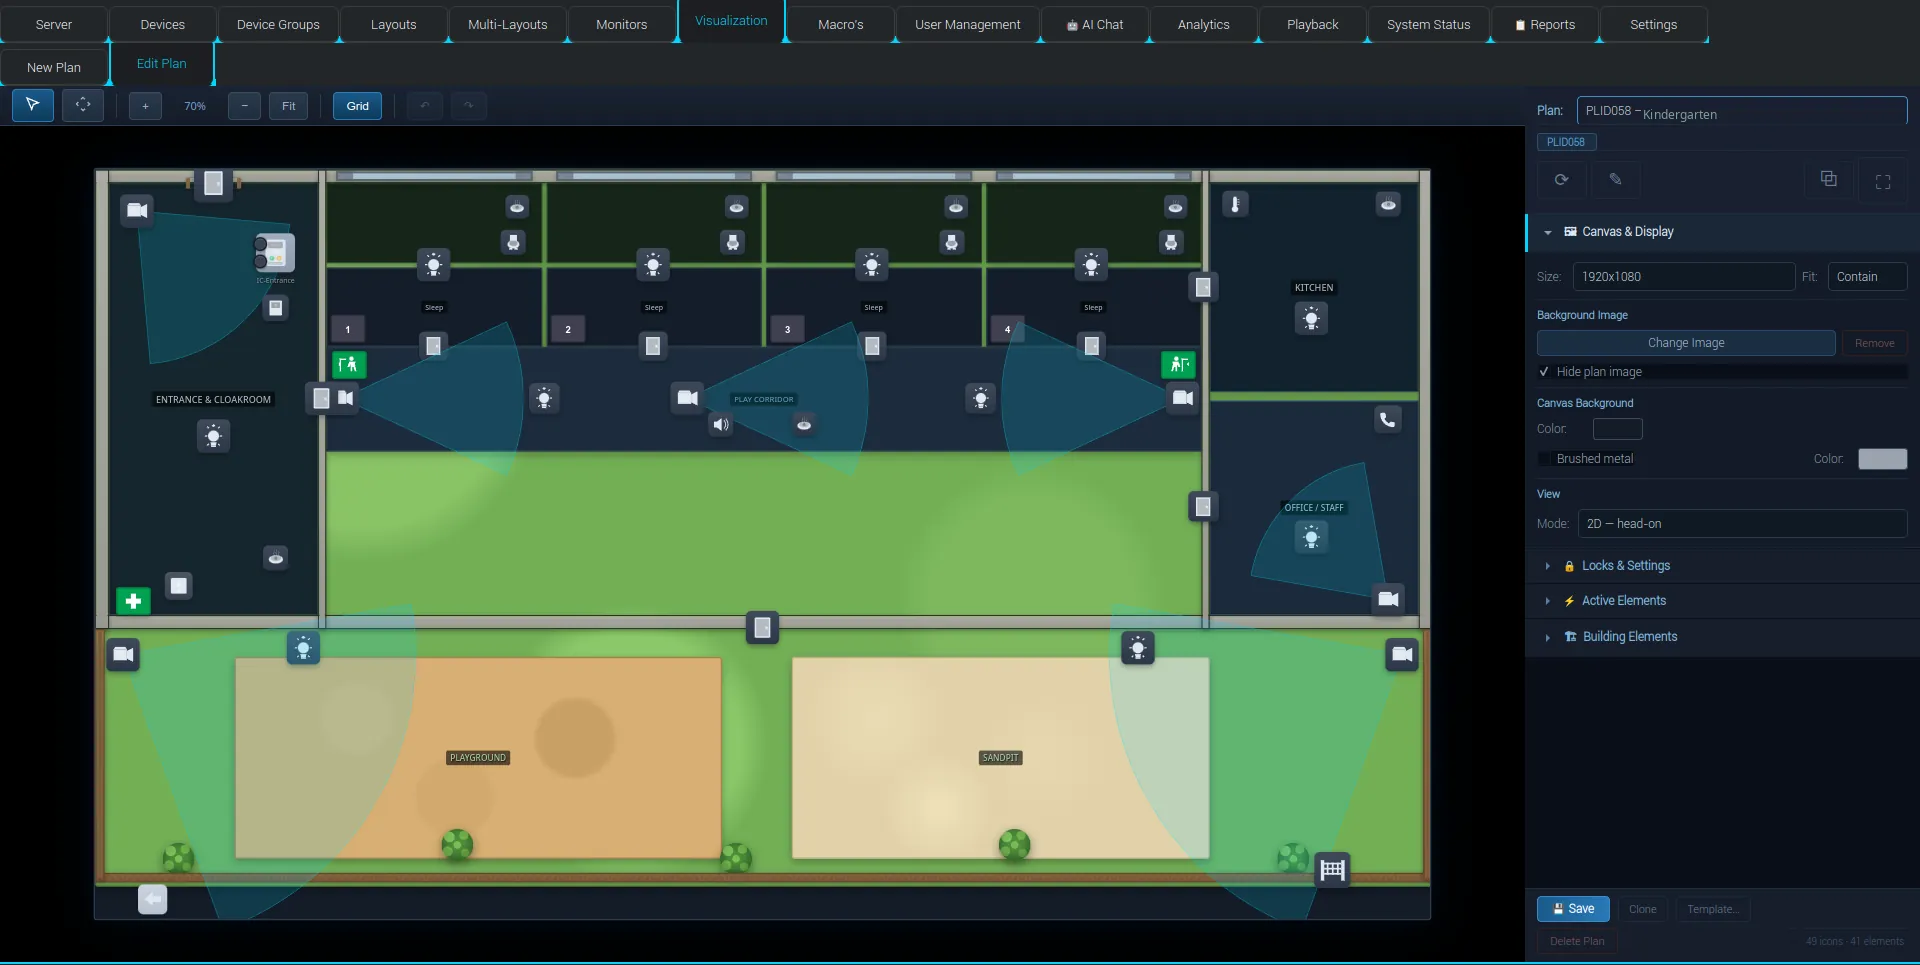
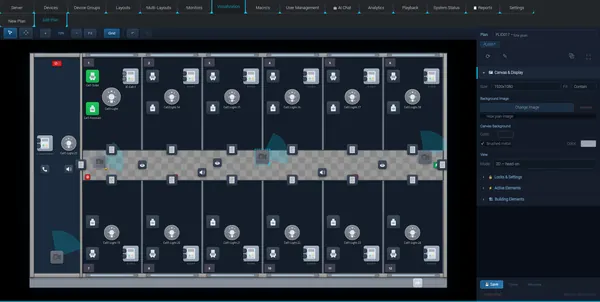
Camera icons draw their viewing cone directly on the plan, so operators see what each camera covers. This kindergarten plan combines rooms, outdoor areas, lights, doors and intercom stations in one picture of the whole site.

How it works

A camera icon carries a direction, an opening angle, a range and a colour, and the plan draws that as a translucent cone over the floor. The cone is part of the stored icon, so operators see the same coverage on every client. The plan mixes rooms, outdoor areas drawn with building elements, lights, doors and intercom icons, each bound to its own device. Clicking a camera icon can open its live preview, so the map doubles as a navigation surface for the video.

Live floor plans
Desktop client

Live floor plans

Draw your site as a floor plan and place cameras, doors, lights and intercoms on it. Cameras show their field of view, and every icon reflects the real state of the device it is bound to. One plan renders the same way on desktop, browser and phone.

How it works

A floor plan is a canvas with an optional background image, drawn building elements and icons, saved on the server with the rest of the system configuration. Each icon is bound to a real object such as a camera, a light, a door output or an intercom, and the server pushes that object's state to every open client, so the icon colour changes when the device changes. Desktop, browser and phone clients all read the same plan definition and draw it themselves, which is why one plan looks the same everywhere. Editing needs the visualization permissions.

Start from a template
Desktop client

Start from a template

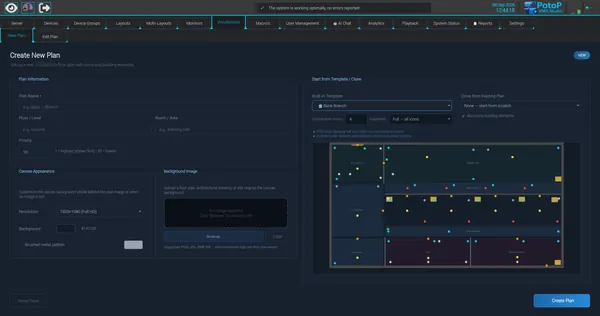
Built-in templates generate a complete plan with walls, rooms, doors and the right icons in seconds. The bank branch template, for example, lays out an ATM lobby, teller counter, vault and safe-deposit room. Adjust room counts and equipment level before creating it.

How it works

The New Plan page holds a set of built-in generators. You pick a building type, answer a few parameters such as the number of consultation rooms and how much equipment to place, and a preview is computed on the spot. On Create, the generator writes walls, rooms, doors and icons into a normal plan on the server. Nothing is locked afterwards: the result is an ordinary plan you edit like a hand-drawn one, and an existing plan can be cloned instead, with or without its building elements.

Templates for every kind of site
Desktop client

Templates for every kind of site

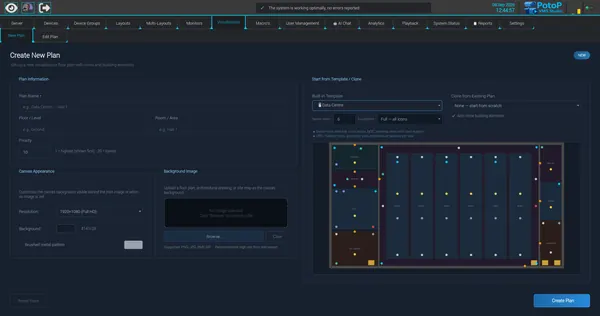
Templates cover many building types, from data centres to schools, hospitals and warehouses. The data centre plan adds server rows, a NOC, UPS room and generator yard, each with icons ready to bind to devices.

How it works

Templates are code-driven generators that lay out rooms, walls and icons from a few parameters, here the number of server rows and the equipment level. The icons are created unbound, with the right type and label for each room, so the installer only has to link each one to a real camera, sensor or output afterwards. Because the output is stored as a normal plan, it can be renamed, moved, extended or cloned like any other. Different building types simply use different generators behind the same form.

Aim the view cone
Desktop client

Aim the view cone

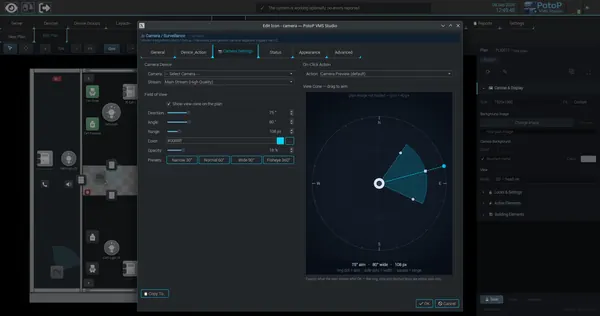
Set direction, angle, range and colour of a camera's view cone by dragging in a live preview. Presets for narrow, normal, wide and fisheye lenses speed up placing many cameras. Choose which stream opens and what a click does.

How it works

The icon editor has a camera tab with a compass preview. You drag a handle to aim, side handles for the width and a square handle for the range, or type values and use lens presets. The preview shows exactly what the plan will draw after OK, while the ring and guide lines exist only in the editor. The same tab chooses which camera and which stream (main or sub) the icon uses and what a click does, such as opening a preview. All values are saved with the icon.

Light icons and status colours
Desktop client

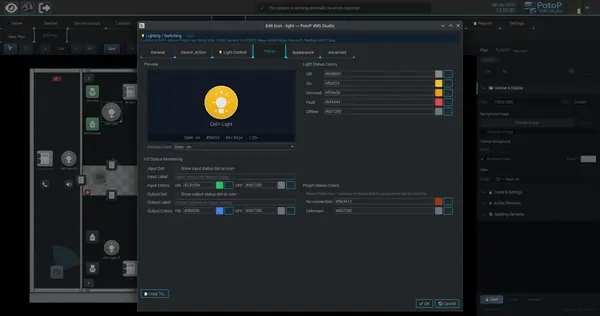
Light icons and status colours

Bind a light icon to a Philips Hue or other supported device and choose how each state looks on the plan: off, on, dimmed, fault and offline, plus input and output status dots. Sensor or intercom inputs can switch the light automatically through macros.

How it works

The dialog shown is the light icon editor, where each state (off, on, dimmed, fault, offline) gets its own colour and optional input and output status dots. A light icon is bound through a device plugin, such as the Philips Hue integration or generic I/O, and the server keeps its state in sync with the real fixture. Automatic switching from intercom or sensor inputs is done by the server-side macro engine, not by the plan itself. Plugin-reported problems, such as no connection, get their own colour on the icon.

Intercom icons with live states
Desktop client

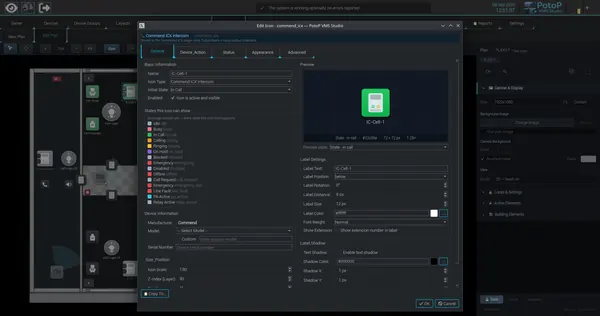
Intercom icons with live states

Intercom stations show idle, ringing, in call, on hold, emergency and line fault directly on the plan. Operators can start a call or open a door with one click, right where the station is located.

How it works

An intercom icon is bound to an intercom plugin, in the dialog the Commend ICX integration, and the server listens to that station's call events. Each event maps to an icon state such as idle, calling, ringing, in call, on hold, emergency or line fault, and every state has its own colour that the editor previews. The state is pushed to all connected clients, so the plan reflects the real station within moments. Actions on the icon, such as calling or opening a door, are sent through the same plugin back to the device.

PIN-protected icons
Desktop client

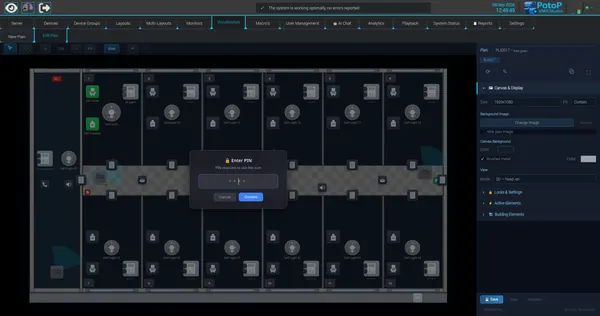
PIN-protected icons

Sensitive icons can require a PIN before they act, so a door or output cannot be operated by accident. Permanent and temporary PIN locks are set per icon in the editor.

How it works

Every icon action can be marked as locked with a PIN. When an operator clicks such an icon, the client asks for the PIN before it sends the command to the server, so a stray click cannot switch an output or open a door. PINs can be permanent or temporary and are set per icon in the editor. The lock is an extra safeguard on top of the normal permission checks, which the server still enforces for whoever is signed in.

Building elements toolkit
Desktop client

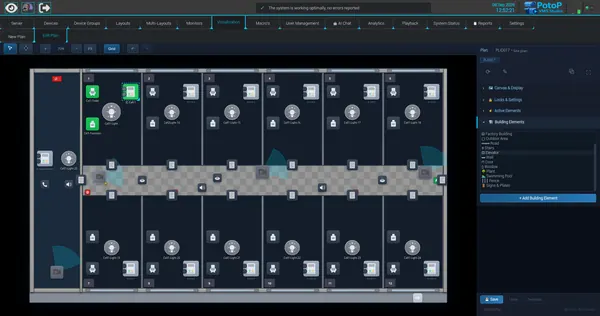
Building elements toolkit

Draw your own plans with fifteen kinds of building elements such as walls, doors, windows, stairs, roads and plants. Elements sit beside the device icons, so a plan can be built without any drawing software.

How it works

The Building Elements panel lists drawable objects such as walls, doors, windows, stairs, elevators, roads, plants, fences, pools and signs, and you can add your own. Elements are vector shapes stored in the same plan as the device icons, with position, size and layer order, so they scale cleanly at any zoom. A plan can therefore be drawn entirely inside the product, or drawn over an uploaded PNG, JPG, BMP or GIF background such as an architect's drawing.

06

Joysticks & control desks 2 screens

USB joysticks and control desks drive PTZ cameras and layouts, mapped button by button.

Joystick button mapping
Highlight Desktop client

Joystick button mapping

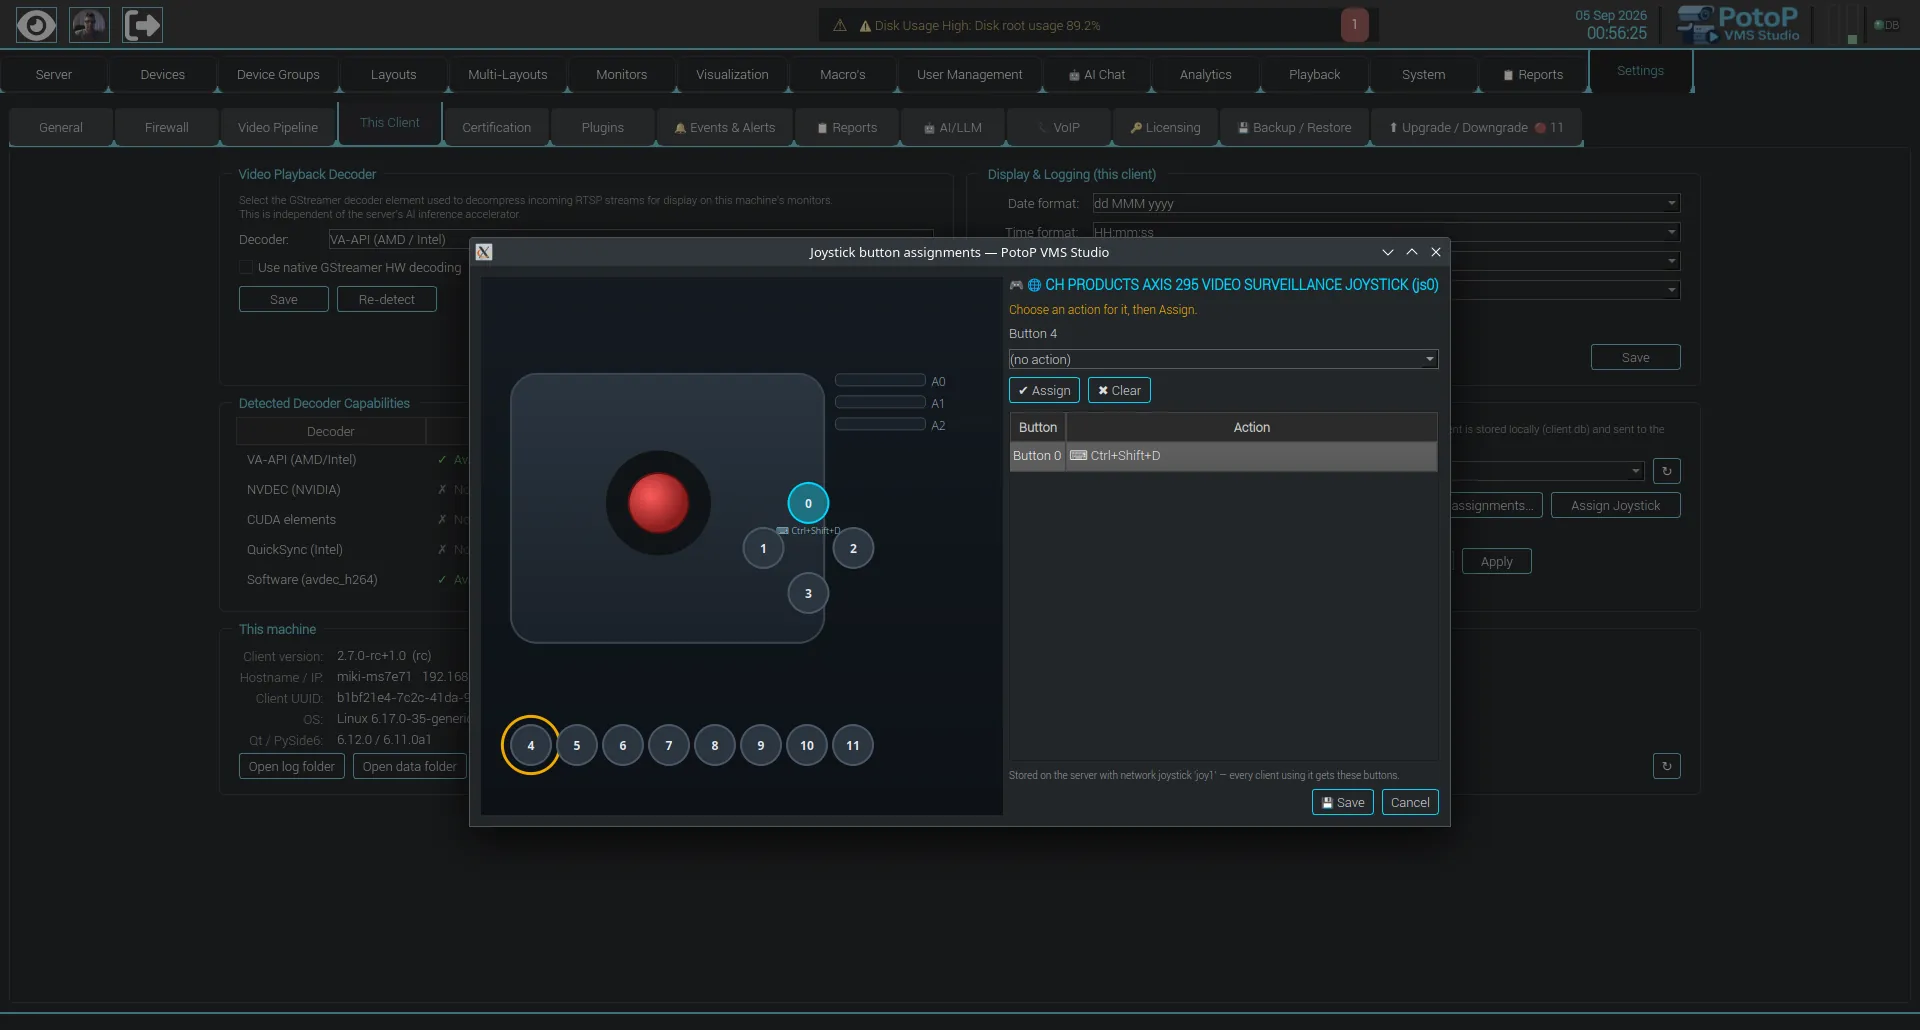
Every button on a network joystick can be assigned an action from a visual controller diagram. Operators steer PTZ cameras and trigger macros without touching the mouse, and each assignment is saved on the server.

How it works

A joystick, whether USB on the operator's PC or a network unit elsewhere, reports its axes and buttons as small frames. Network devices send them to the server over UDP or HTTP, and the server relays them over a WebSocket to every client that selected that joystick. The client reads axes as pan, tilt and zoom, and looks up each button in a mapping table. The diagram dialog edits that table: pick a button, choose an action such as a shortcut, macro or preset, and press Assign. The table is saved on the server under the joystick's identity, so every client using it gets the same assignments.

Connected clients and joysticks
Web client

Connected clients and joysticks

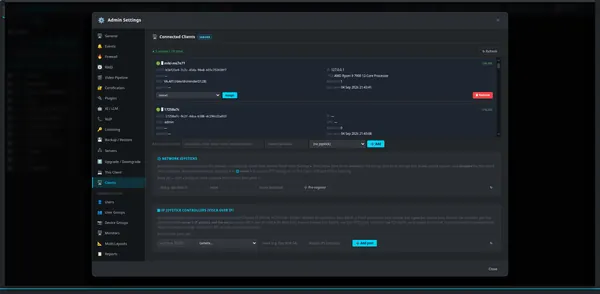
The Clients page lists every desktop and browser client with its status, and lets an administrator assign a joystick to each one. Network joysticks and IP joystick controllers are managed in the same place.

How it works

Every desktop and browser client registers with the server under a unique ID and keeps reporting in, so the page can show what is online, its user, GPU, monitor count and last-seen time. An administrator can pre-register a client by its ID or remove one. Assigning a joystick binds a device record to that client. Network joysticks send small UDP or HTTP frames and stay disabled when first seen, so nobody on the LAN can steer cameras until an administrator enables them. IP joystick controllers connect over VISCA-over-IP: the server listens on a port and behaves like a camera, and forwards commands to the real camera's PTZ interface.

07

Devices 3 screens

Every camera, encoder and device in one list, grouped for access control.

Every camera in one list
Highlight Desktop client

Every camera in one list

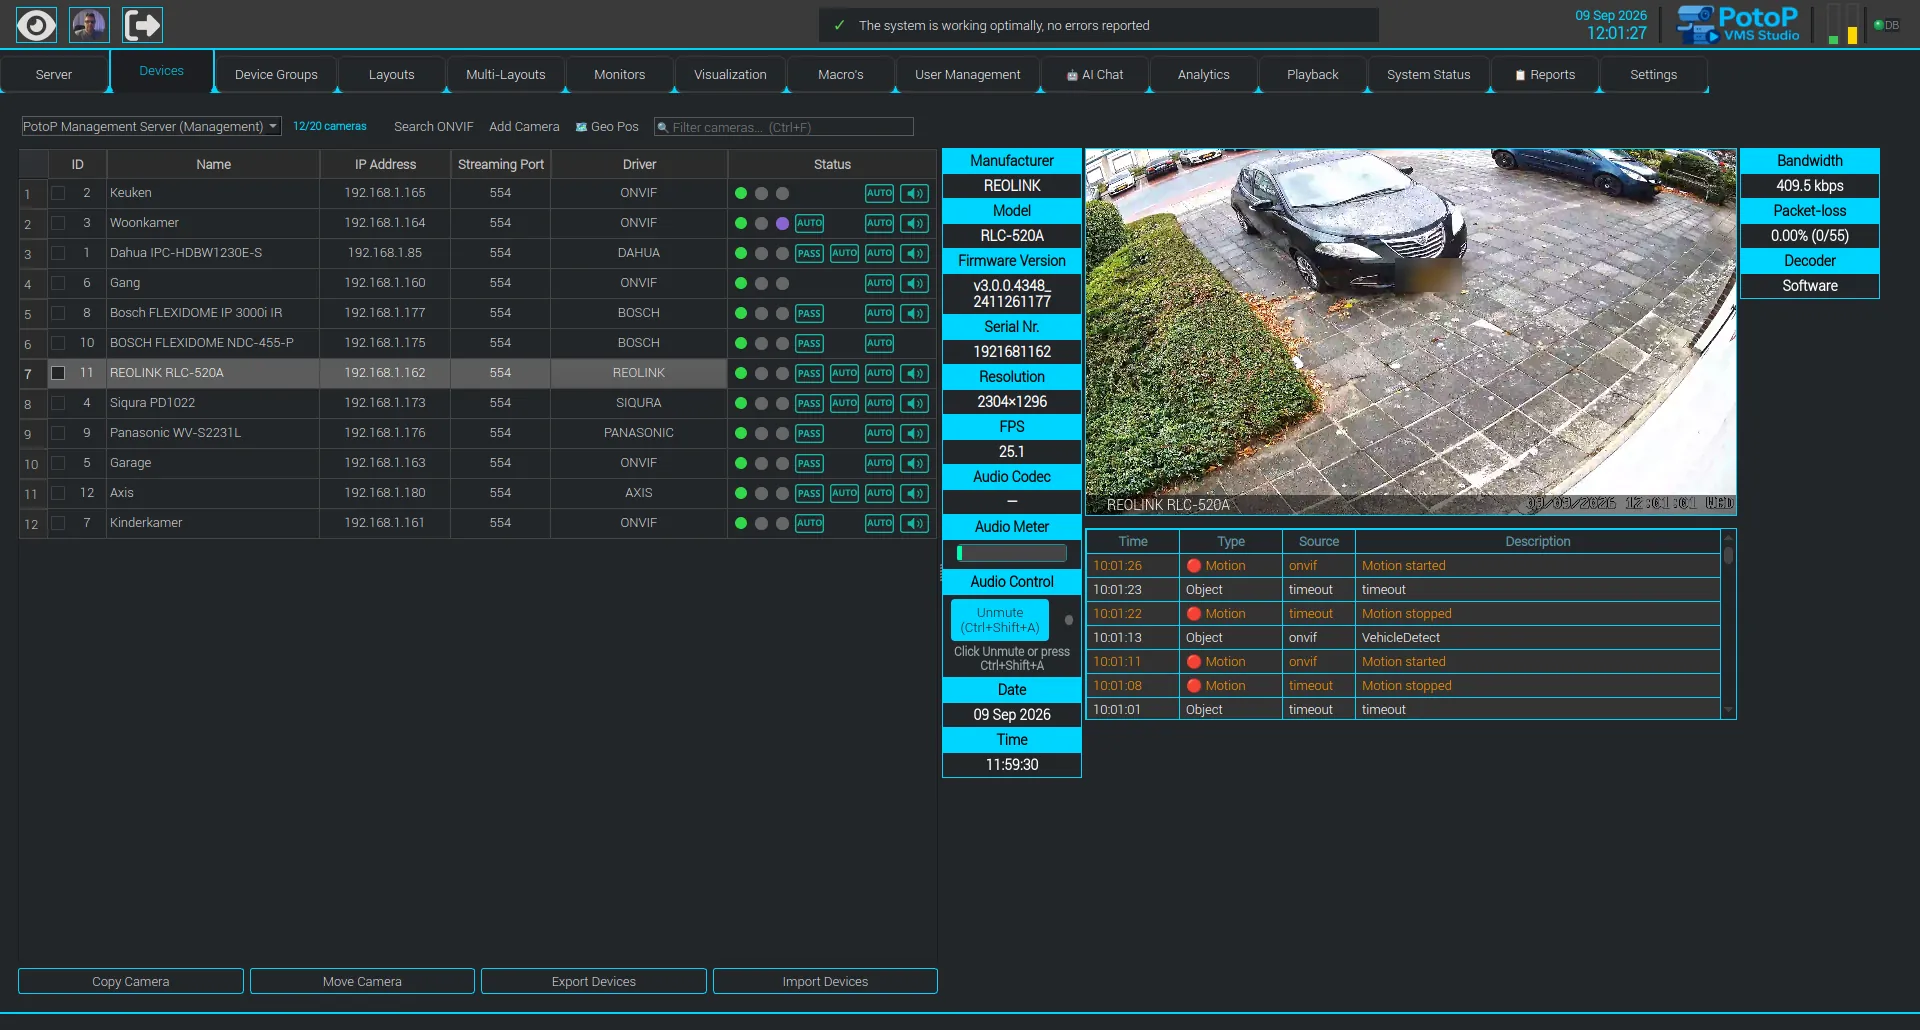
All cameras of a server appear in one table with IP address, driver and live status. Selecting a row shows a live preview, manufacturer, model, firmware, resolution, frame rate and bandwidth, next to the latest device events. Copy, move, export and import keep large installations manageable.

How it works

The Devices tab reads the camera table from the selected server and shows driver, address and live status for each row. Adding a camera goes through ONVIF discovery or a vendor driver, and streams are pulled over RTSP. Selecting a row opens a live preview on the client, while manufacturer, model, firmware, serial, resolution, frame rate and bandwidth come from the camera and the running stream. The event list below is fed by the camera's own ONVIF events. Copy, move, export and import run as bulk operations against the server.

Device groups for access control
Desktop client

Device groups for access control

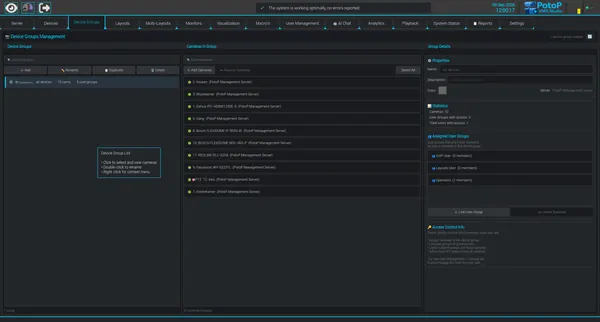
Cameras are collected into named device groups, each showing its camera count and the user groups that may see it. Statistics and linked user groups sit beside the member list. Access follows the group, so new cameras inherit the right visibility.

How it works

A device group is a named set of cameras on a server. User groups are linked to device groups, and when a user asks for cameras the server returns only those that belong to a device group linked to one of the user's groups. Statistics show the camera count, how many user groups and how many users have access. Because the rule is evaluated by the server and not the client, a camera added to a group is visible to the right people at once, and the built-in administrator always sees everything.

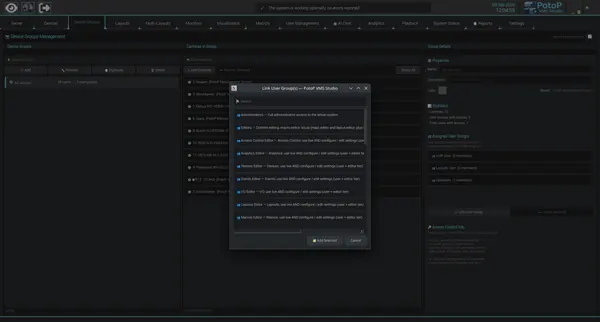
Link user groups to cameras
Desktop client

Link user groups to cameras

A device group is linked to one or more user groups from a searchable list that shows what each group can do. Members of those groups see the cameras in the device group and nothing else. This keeps access rules readable.

How it works

The picker lists all user groups with a short description of what each is allowed to do, and a search field narrows the list. Adding a group stores a link between that user group and the device group on the server. From then on, every member of that group gets the group's cameras in live view, playback and layouts, and no others through this link. Linking and unlinking is one step and takes effect for signed-in users without a restart.

08

Reports & events 5 screens

Everything that happens is logged, reportable as a branded PDF and able to start a macro or send an alert.

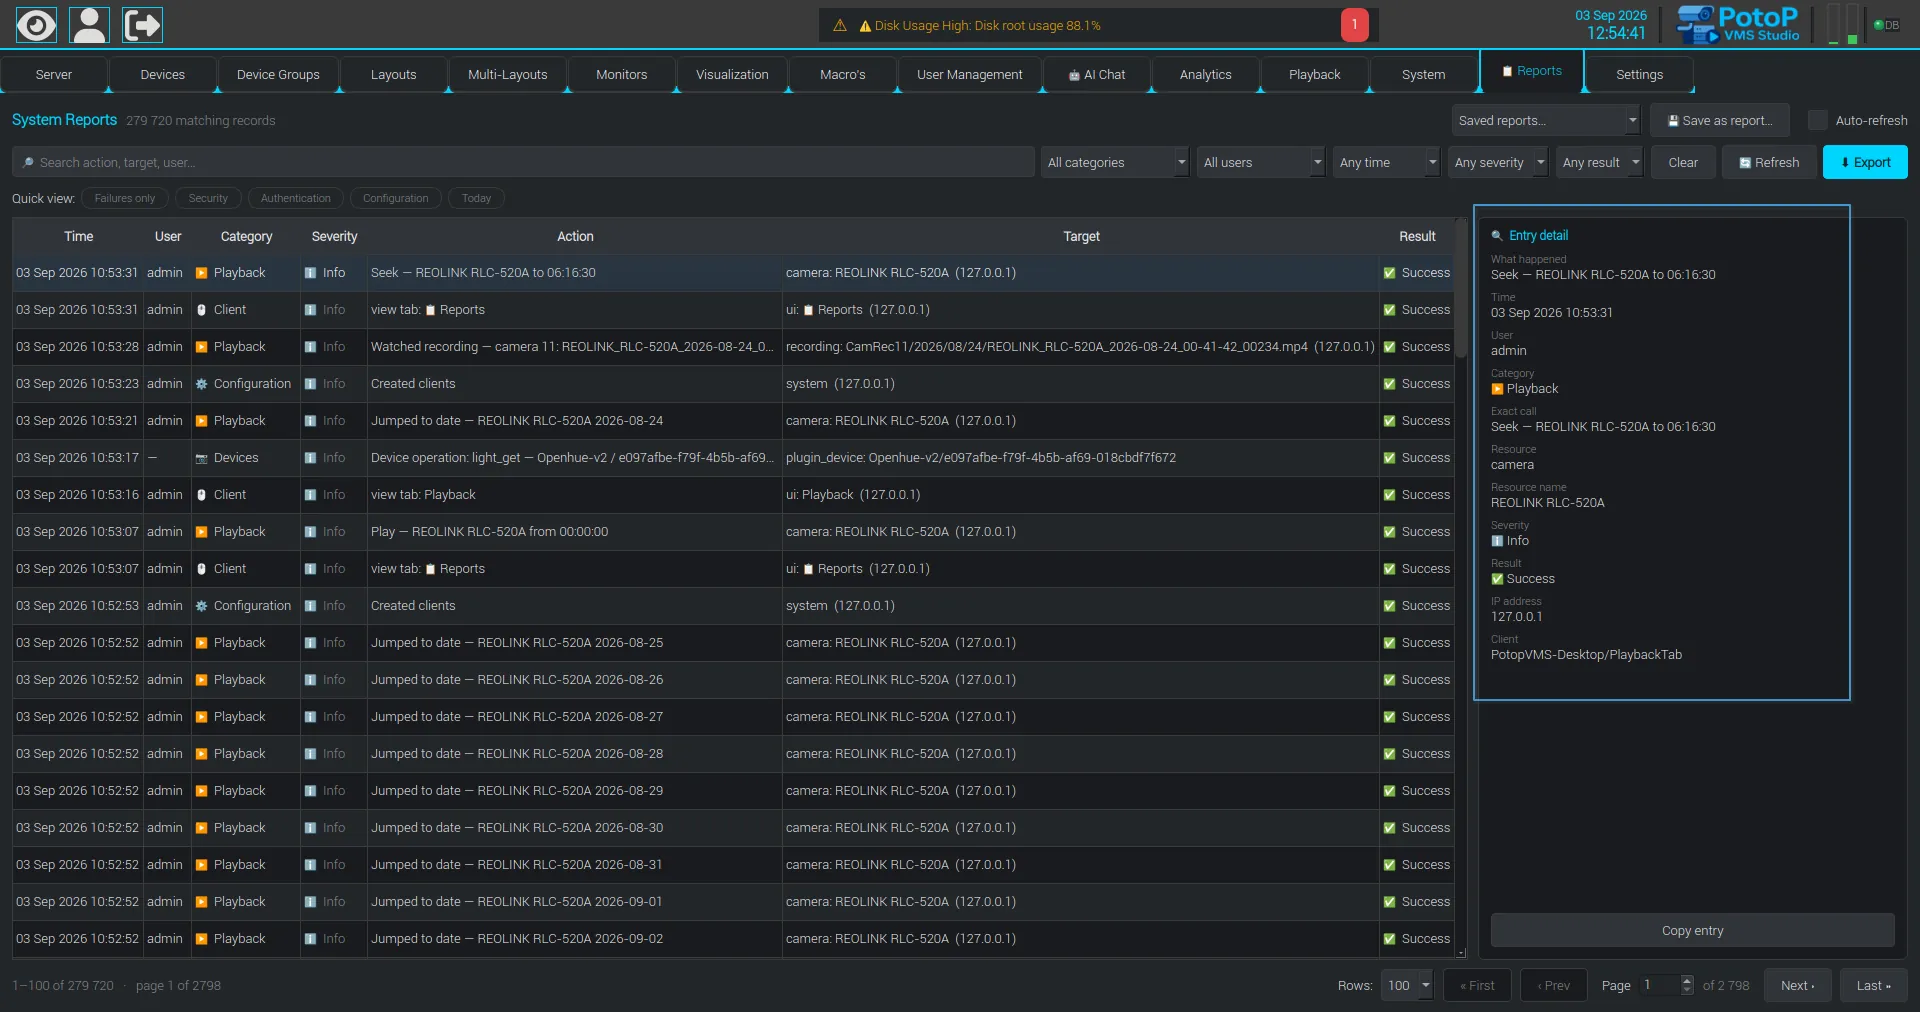
Every action is recorded
Highlight Desktop client

Every action is recorded

The audit trail logs who did what, when and with which result, with categories, severity and full entry detail. Search, filter and export help with compliance reviews and incident follow-up.

How it works

Every client action and server-side change is written as one row in an append-only audit log kept in a dedicated reports database, apart from the main configuration, so heavy logging cannot slow down the video system. A row holds time, user, category, severity, action, target, result, IP address and the client that made the call. The Reports tab queries it with paging, search, filters, saved reports and export, and the detail pane shows the complete entry. Nothing in the interface can edit or delete a single entry.

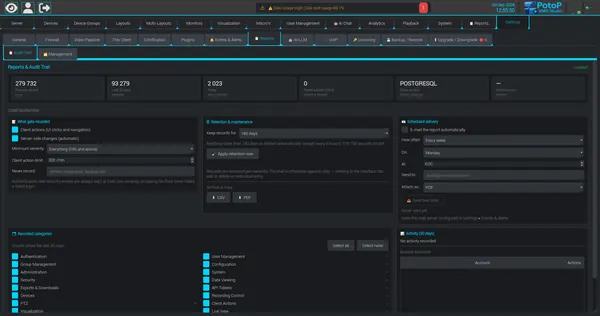
Audit trail controls
Desktop client

Audit trail controls

Choose what gets recorded, set retention in days, and archive a copy as CSV or PDF. A scheduled report can be mailed automatically to chosen recipients.

How it works

Administrators choose whether client actions and server-side changes are recorded, the minimum severity, which categories to keep, and how many days to retain. A background sweep removes older rows on a schedule, and Apply retention now runs it on demand. Authentication and security events are always kept at their own severity. The trail can be downloaded as CSV or PDF, and a scheduled job can mail the report weekly or as chosen, using the mail server configured in the event settings.

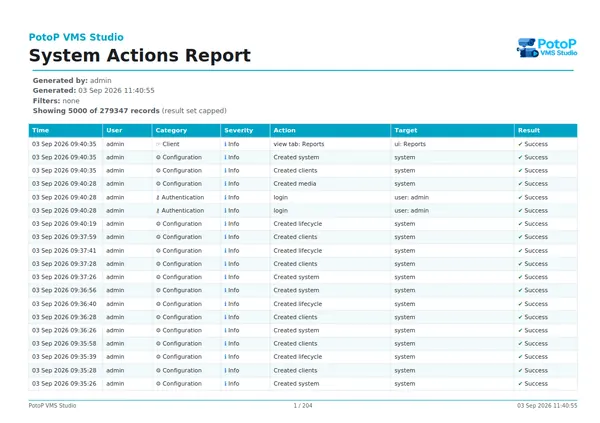
Branded PDF reports
PDF report

Branded PDF reports

Reports export as printable PDFs with the product branding, filters and generation details. Share them with auditors or management without further formatting.

How it works

The PDF is generated on the server from the same audit rows the Reports tab shows, using a standard Python PDF library rather than a screenshot. It contains the product header and logo, who generated the report and when, the active filters, a paginated table with a repeating header row, and a page footer. Very large result sets are capped, and the report says so explicitly, for example showing 5000 of the total. The scheduled e-mail report attaches this same file.

Events that start macros
Desktop client

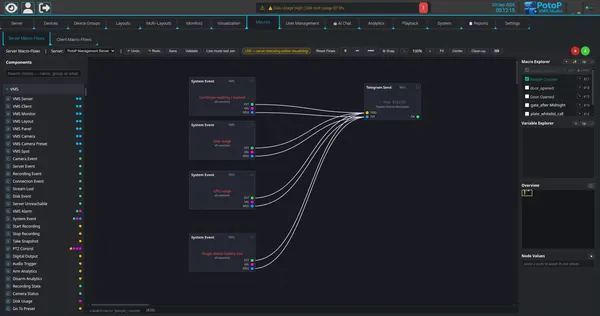
Events that start macros

System events such as certificate expiry, disk usage or device battery low can start a macro flow. Here four events feed a Telegram message node, all built visually without code.

How it works

The macro editor is a visual node graph that runs on the server. A System Event node fires when the health monitor raises a matching event, such as a certificate about to expire, high disk or GPU usage or a low device battery, and passes the event text and value on its output ports. Wired into a Telegram Send node, it posts a message through the Telegram bot API. The graph is checked with Validate, can be simulated, and while it is live the editor shows the values passing through each node.

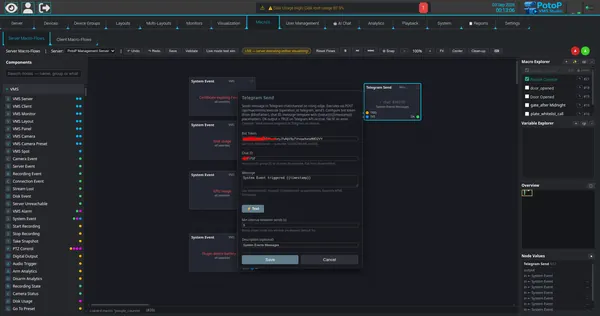
Telegram alerts from a macro
Desktop client

Telegram alerts from a macro

A Telegram Send node posts a message to a chat or channel when an event reaches it. Bot token, chat ID and message template with placeholders are set in the node, a Test button checks delivery, and a minimum interval between sends avoids repeated alerts.

How it works

The screen shows the Telegram Send node of the macro editor: bot token, chat ID, a message template with placeholders for time and value, a Test button and a minimum interval between sends so repeated events do not flood the chat. The server posts to the Telegram bot API when the node receives a rising edge. E-mail alerts use the SMTP server configured under event settings. Events themselves come from the server's health monitor and the camera event feeds.

09

Users & permissions 8 screens

Groups, roles and a permission matrix decide who sees which camera and who may change what.

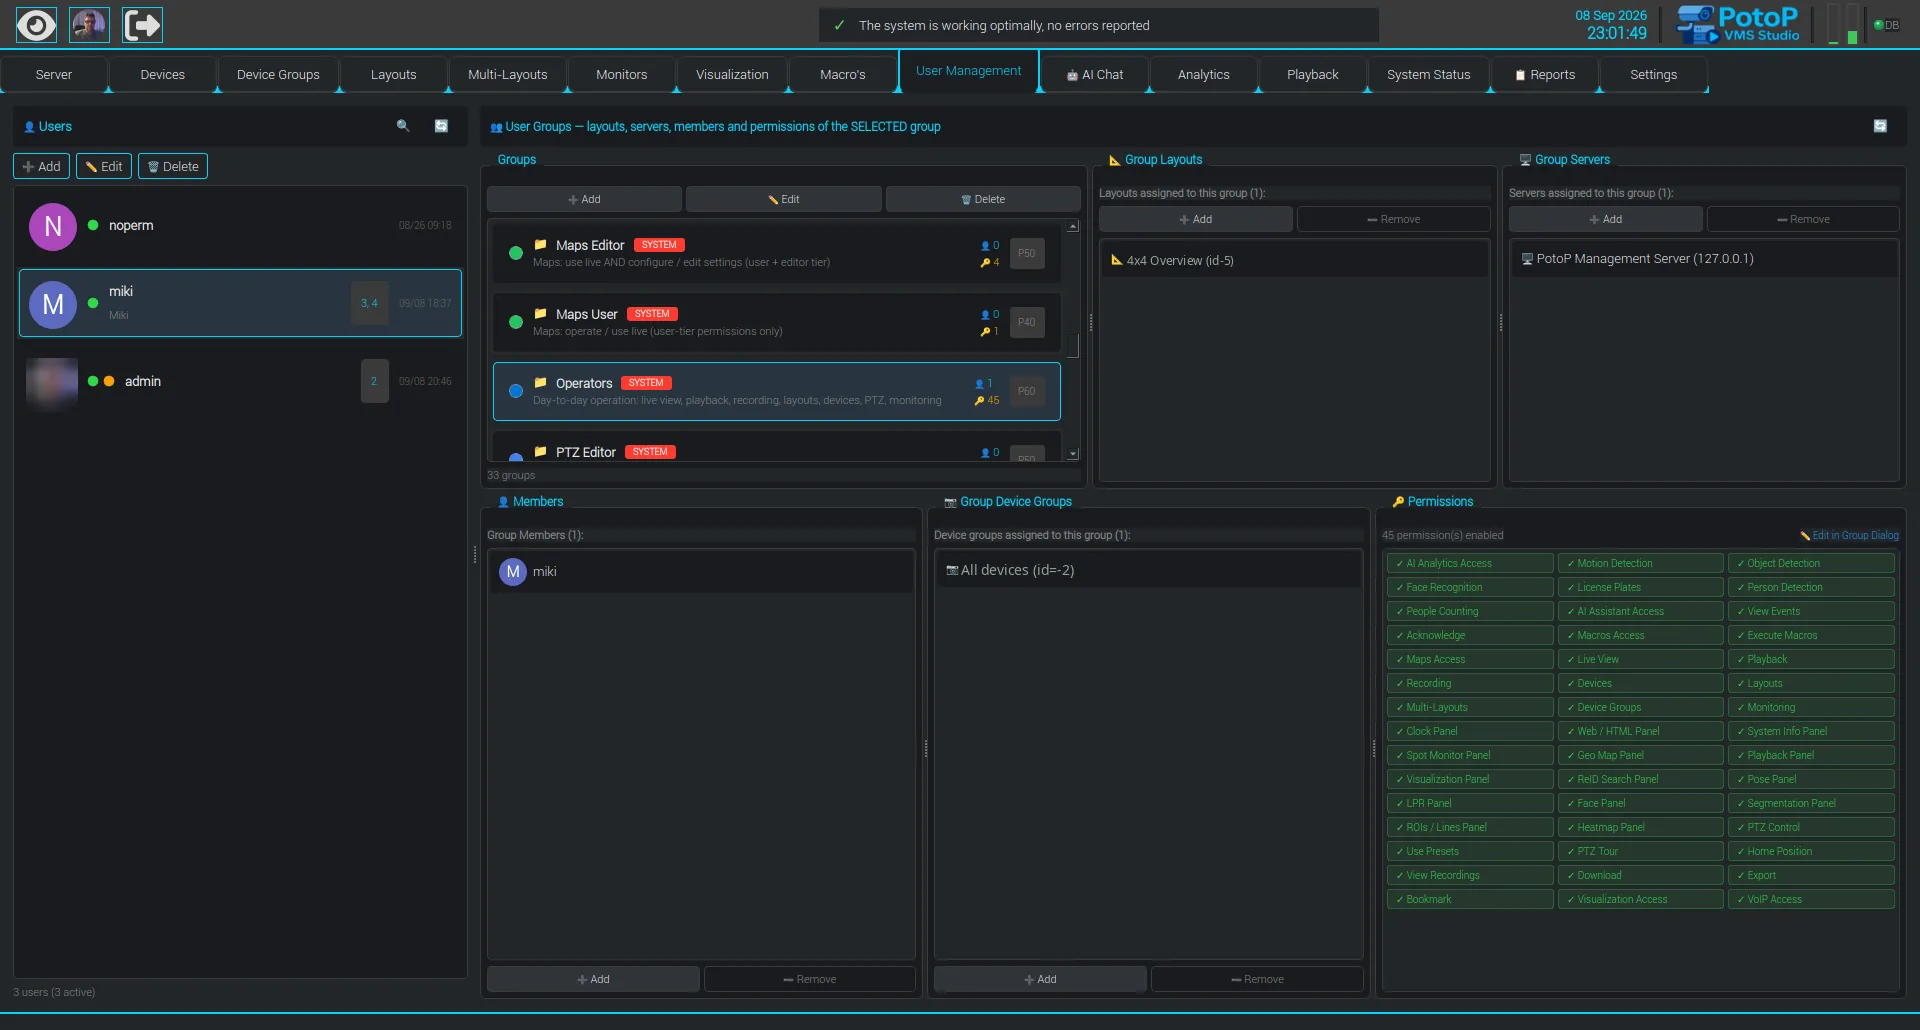
Users, groups and permissions
Highlight Desktop client

Users, groups and permissions

User Management lists the accounts, their online state and the groups they belong to. For the selected group it shows its layouts, servers, members, assigned device groups and the permissions it grants. One screen gives the full picture of who can do what.

How it works

User Management works on accounts, groups and links. Selecting a group shows its layouts, its servers, its members, its device groups and the permissions it enables, all read from the server. Users get their rights through the groups they belong to, and a permission check is made by the server on each request, not only by hiding buttons in the client. The online dots come from live sessions. Around 30 groups ship ready-made, covering typical operator and editor roles.

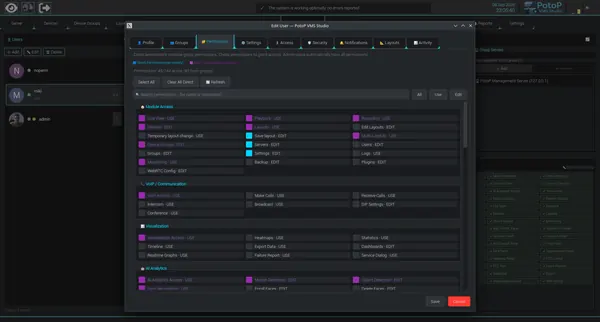
Fine-grained permission matrix
Desktop client

Fine-grained permission matrix

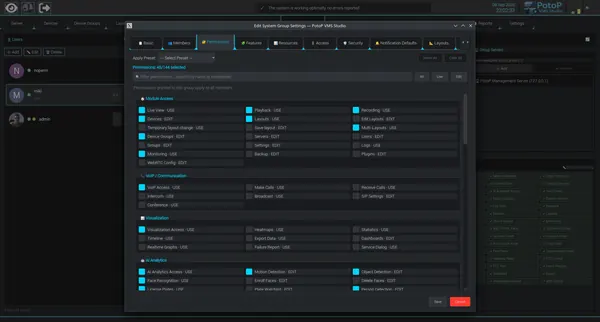
Permissions are split per module and per action, such as use, edit or delete, and can be filtered by name or applied from a preset. Live view, PTZ, recording, VoIP, visualization and AI analytics are granted separately. Operators get exactly the rights their job needs.

How it works

The server defines around 144 permissions, each with a module and an action level such as use or edit. The group dialog lists them in sections, with a filter box, all/use/edit shortcuts and presets that tick a typical set. The server checks the relevant permission on every API call and live channel, so a user without PTZ or recording rights is refused even when calling the API directly. Denied attempts are written to the audit trail with the permission name.

Role-based groups
Desktop client

Role-based groups

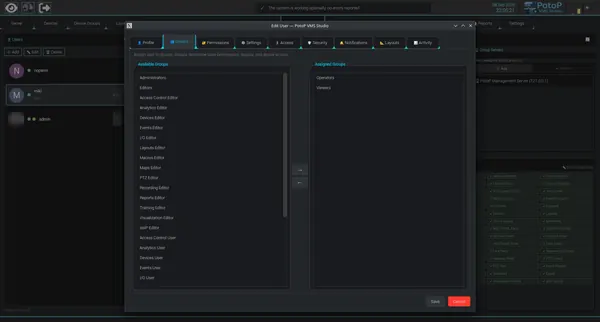
Users are assigned to ready-made groups such as Operators, Viewers and specialised editors for layouts, macros, maps or PTZ. Group membership decides the base permissions, layouts and device access. Roles stay consistent across many users.

How it works

Instead of granting rights user by user, an administrator moves users between ready-made groups such as Operators, Viewers and editor or user pairs for layouts, macros, maps, PTZ, devices and more. A user's effective rights are the union of the rights of all groups they are in, plus their layouts and the cameras of the device groups linked to those groups. Changing a group changes every member at once, which keeps roles consistent across many accounts.

Limits per group
Desktop client

Limits per group

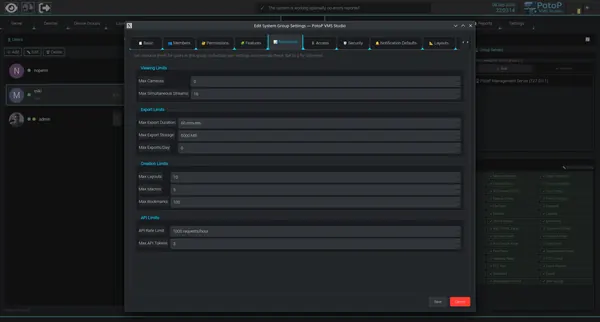
Each group can be capped on simultaneous streams, export duration and storage, number of layouts, macros and bookmarks, and API rate. Limits protect server capacity and keep shared installations predictable.

How it works

The Resources tab of a group sets numeric ceilings, with zero meaning unlimited: cameras and simultaneous streams a member may open, export length, size and count per day, how many layouts, macros and bookmarks they can create, and API requests per hour and tokens. The server enforces them when a request is made, for example refusing a stream beyond the cap. Individual user settings can override the group value, so a shared installation stays predictable under load.

Password and login policy
Desktop client

Password and login policy

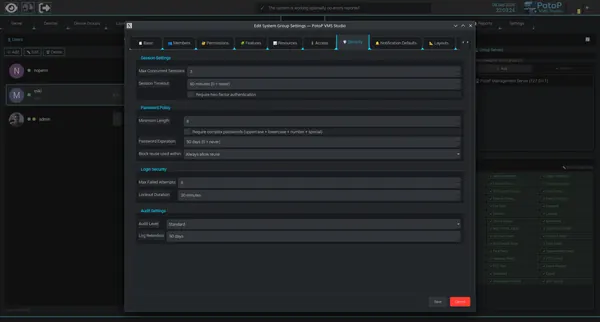
Security settings define concurrent sessions, session timeout, two-factor requirement, password length and expiry, failed-attempt lockout and audit log retention. Policy is set once per group and applies to every member.

How it works

The Security tab of a group defines concurrent sessions, session timeout, mandatory two-factor authentication, minimum password length, complexity, expiry, reuse blocking, failed-attempt lockout and its duration, plus audit level and log retention. The server enforces the policy at sign-in and on password changes, where passwords are stored as salted bcrypt hashes, not in readable form. Sign-in timing is equalised so an unknown user name cannot be told from a wrong password.

Direct permissions on a user
Desktop client

Direct permissions on a user

Beyond group rights, an individual user can receive extra direct permissions. Group-inherited and direct permissions are colour-coded, so an administrator sees at a glance where each right comes from.

How it works

The user's Permissions tab shows the same matrix as a group, with two colours: blue boxes are direct permissions that can be changed here, purple ones come from the user's groups and are read-only in this view. The server combines both sets when it checks a request. Direct permissions are useful for one-off exceptions, and the counter shows how many of the total are active and how many come from groups. Clear All Direct removes exceptions without touching group rights.

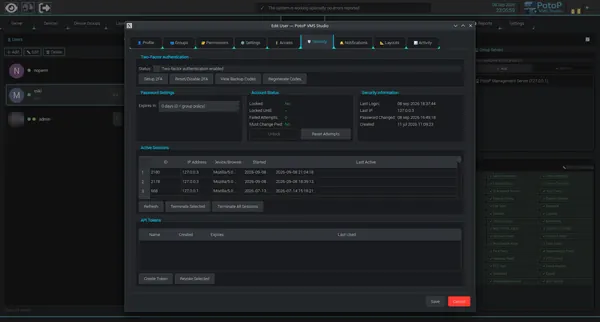
Two-factor, sessions and API tokens
Desktop client

Two-factor, sessions and API tokens

Per user, administrators manage two-factor authentication and backup codes, unlock accounts, and review and terminate active sessions. API tokens can be created and revoked here, which supports integrations without sharing passwords.

How it works

The Security tab manages a user's second factor, which is a time-based one-time password (TOTP) compatible with common authenticator apps, together with one-time backup codes. It also shows account state such as lock, failed attempts and last login, and lets an administrator unlock or reset. Active sessions are listed with IP and browser and can be ended one by one or all together. API tokens are separate credentials with a name and expiry, so scripts and integrations do not need the user's password, and they can be revoked at any time.

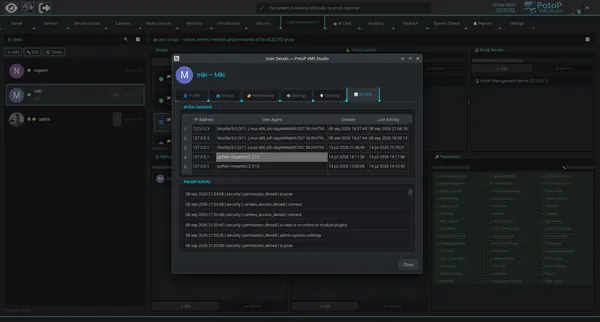
User audit trail
Desktop client

User audit trail

The activity tab lists active sessions with client and IP address, followed by recent security events such as denied permissions. Every action is attributable, which supports audits and incident review.

How it works

The Activity tab reads two things from the server for one user: the active sessions, with IP address, client string and last activity, and the latest security events from the audit trail. Refused actions, such as a denied permission or a camera the user may not see, are logged at the moment the server rejects the request, together with the permission or resource name. Sessions show the kind of client, for example a browser or a script using the API, which helps separate normal use from unexpected access.

10

Certificates & security 7 screens

PotoP runs its own certificate authority, so cameras, servers, browsers and phones talk over verified HTTPS.

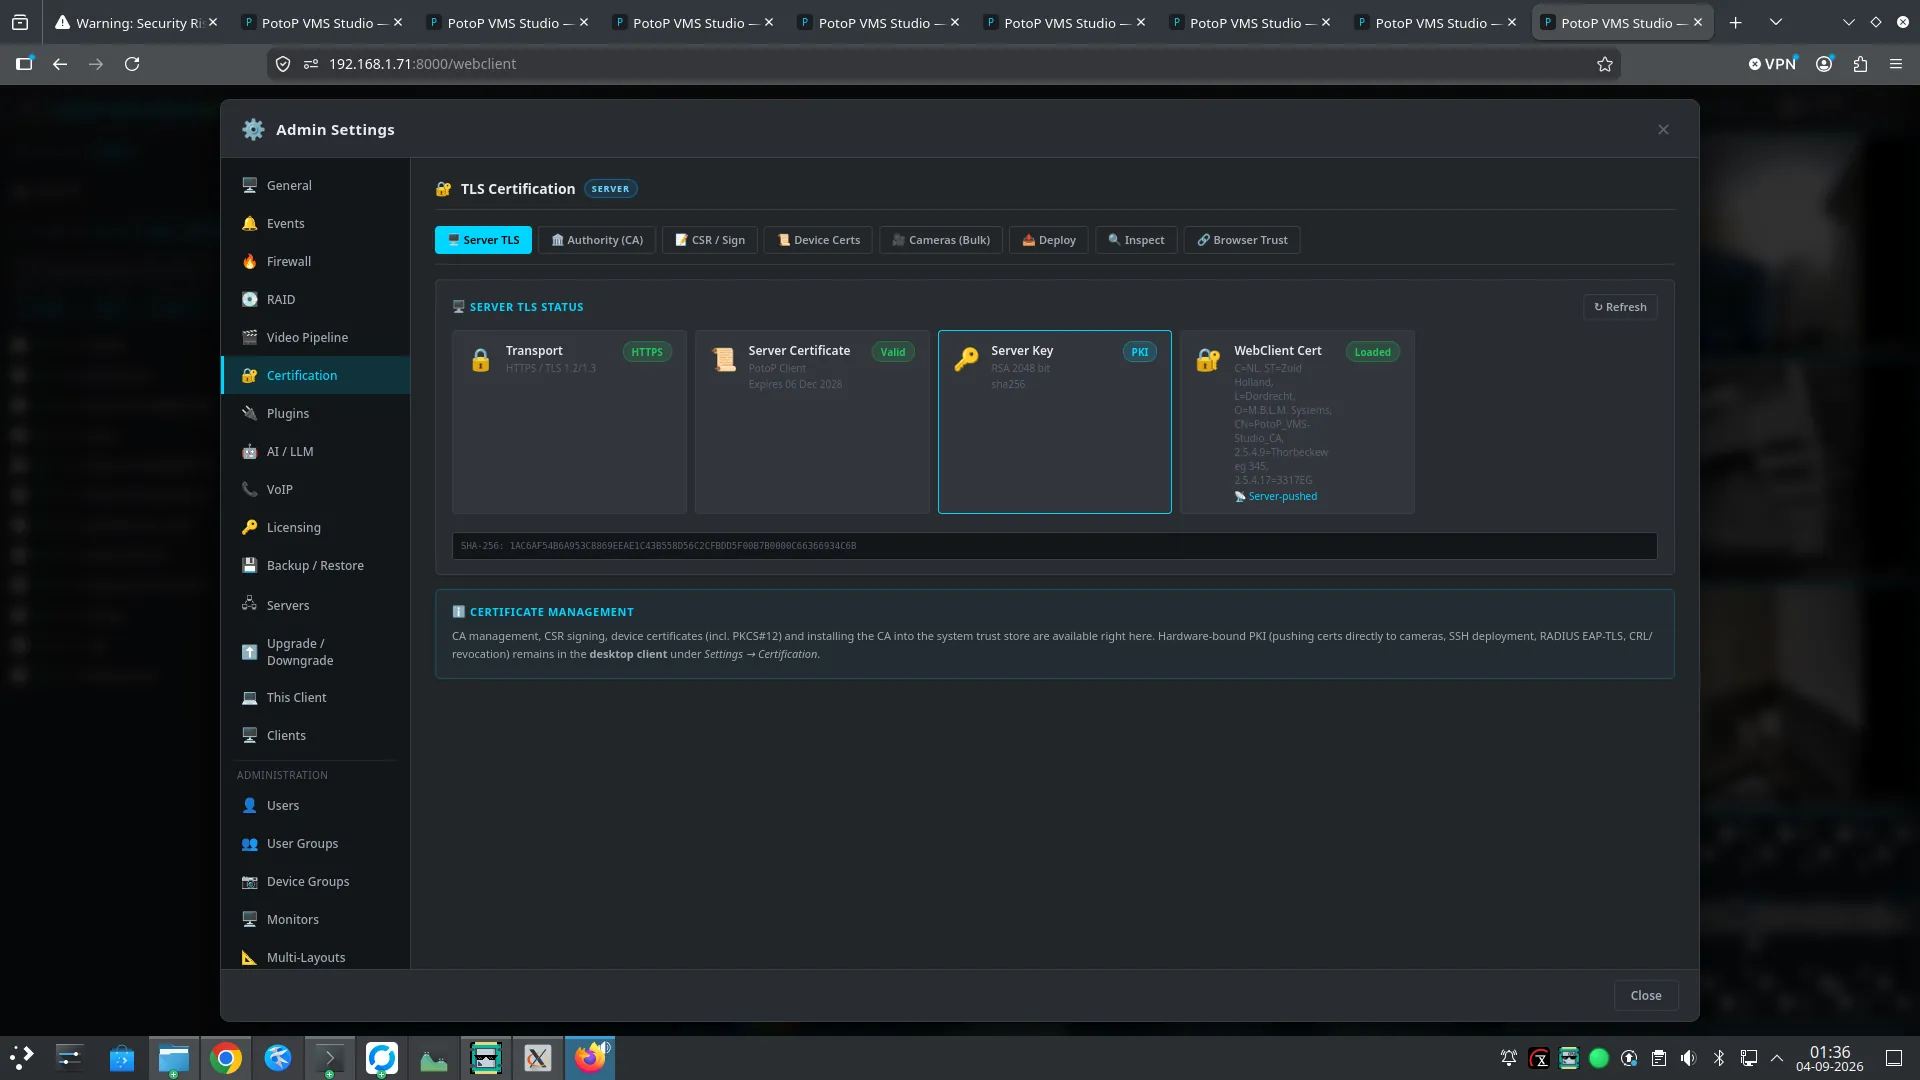
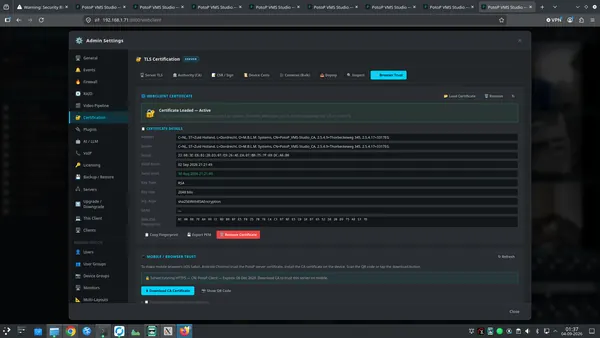
TLS status at a glance
Highlight Web client

TLS status at a glance

The web admin panel shows transport, server certificate validity, server key and the loaded web-client certificate together with its fingerprint. Operators can confirm within seconds that the system is encrypted and when a certificate expires.

How it works

The web admin panel asks the server for its current TLS state and shows four cards: the transport in use (HTTPS with TLS 1.2 or 1.3), the server certificate and its expiry date, the type and size of the server key, and the certificate loaded for browsers with its SHA-256 fingerprint. The same expiry data feeds a background watcher that raises events for the server, the certificate authority, peer servers and cameras before anything expires, so alerts can go to macros, e-mail or Telegram.

Your own certificate authority
Web client

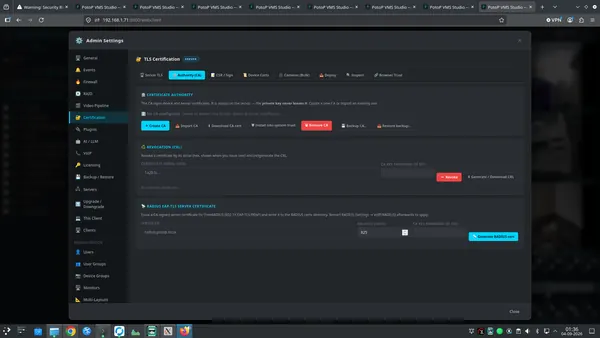
Your own certificate authority

The system can create or import a certificate authority, download its certificate, back it up and revoke certificates through a CRL. The CA private key stays on the server. Devices and clients then trust one root that you control.

How it works

The server can generate a certificate authority or import an existing one. The CA certificate and its private key are stored on the server, with the key file readable only by the service account and optionally protected by a password, and only signed certificates leave the machine. The tab also downloads the CA certificate, backs it up and restores it, installs it into the system trust store, revokes certificates by serial number and builds a revocation list (CRL). A RADIUS server certificate for 802.1X can be issued from the same CA.

Issue device certificates
Web client

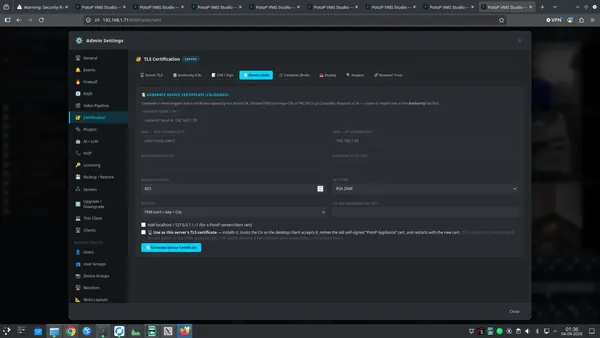
Issue device certificates

A device certificate is generated and signed by the stored CA for a name and IP address, with a validity period and a choice of output format. It can also be installed as the server certificate, removing browser warnings.

How it works

A new key pair is generated and a certificate is signed by the stored CA for the given name, DNS and IP entries, with a chosen validity and key type. The result is offered as PEM (certificate, key and CA) or as a PKCS#12 bundle. Ticking the server option installs the certificate as the server's own, trusts the CA for the desktop client, retires the old self-signed one and restarts the service, so browsers stop showing warnings once they trust the CA.

Bulk HTTPS for cameras
Web client

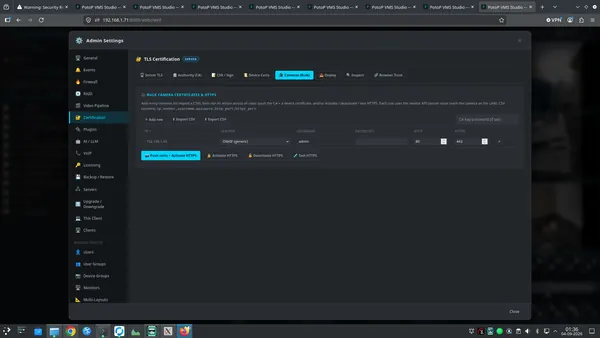
Bulk HTTPS for cameras

Cameras are listed or imported from CSV, then certificates are pushed and HTTPS is activated on all of them in one run. Vendor APIs are used, so no one has to log in to each camera separately.

How it works

You list cameras by hand or import a CSV with address, vendor, credentials and ports. For each row the server issues a device certificate from the CA, and pushes the certificate and CA to the camera through that vendor's own web API, then switches on HTTPS. There are also actions to deactivate HTTPS and to test it. The server must reach the cameras on the network, and credentials are used only for the run. The result is one pass instead of logging in to every camera.

Push certificates to cameras
Web client

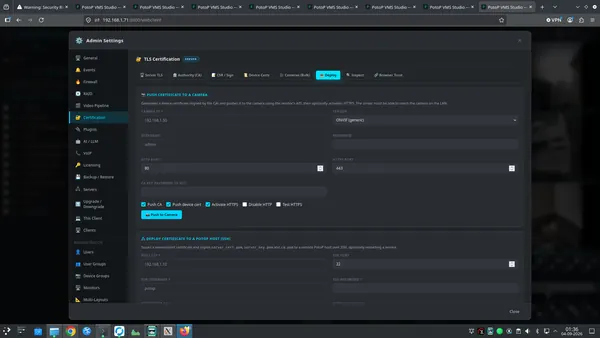
Push certificates to cameras

A signed certificate can be pushed to a single camera, with options to push the CA, activate HTTPS, disable plain HTTP and test the connection. Below it, a second section deploys certificates to another PotoP host over SSH.

How it works

For one camera, the server signs a device certificate, uploads it with the vendor's API, can push the CA, activate HTTPS, disable plain HTTP and test the secure connection. The second section connects to another PotoP host over SSH, copies the certificate, key and CA file to the destination directory and can restart a service. Both operations run on the server, so it must be able to reach the target, and they need administrator rights.

Trust on browsers and phones
Web client

Trust on browsers and phones

The active web-client certificate is shown with subject, validity, key size and fingerprint. A download and QR code let phones and tablets trust the server, while an install script does the same for Linux, macOS and Windows.

How it works

The panel shows the certificate currently loaded for the web client with subject, issuer, validity, key type and size, signature algorithm and SHA-256 fingerprint, and can export it as PEM. The mobile section serves the CA certificate for download, or as a QR code that a phone or tablet can scan, so the device can trust the server once and stop warning. Installation instructions and scripts are provided for Linux, macOS and Windows.

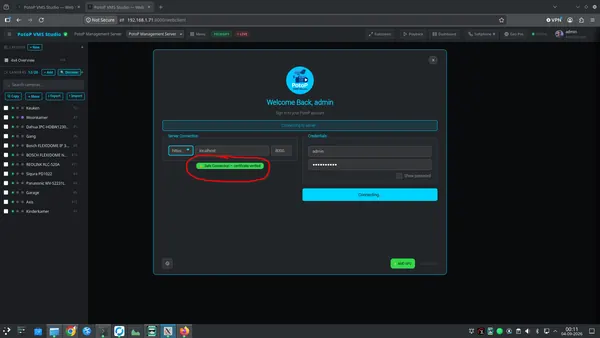
Verified connection at sign-in
Web client

Verified connection at sign-in

The sign-in screen confirms with a green message that the connection is safe and the certificate is verified before credentials are sent. Users can trust the server they are connecting to.

How it works

Before the password is sent, the sign-in page contacts the chosen server over HTTPS and checks the certificate against the browser's trust store. If the chain is valid and matches, the green Safe Connection message appears, otherwise the user sees a warning. That check is done by the browser's own TLS stack, so it cannot be faked by the page. The credentials are then sent to the verified server over the encrypted connection.

11

Storage & RAID 5 screens

Build and maintain RAID arrays from the client and always know how healthy your storage is.

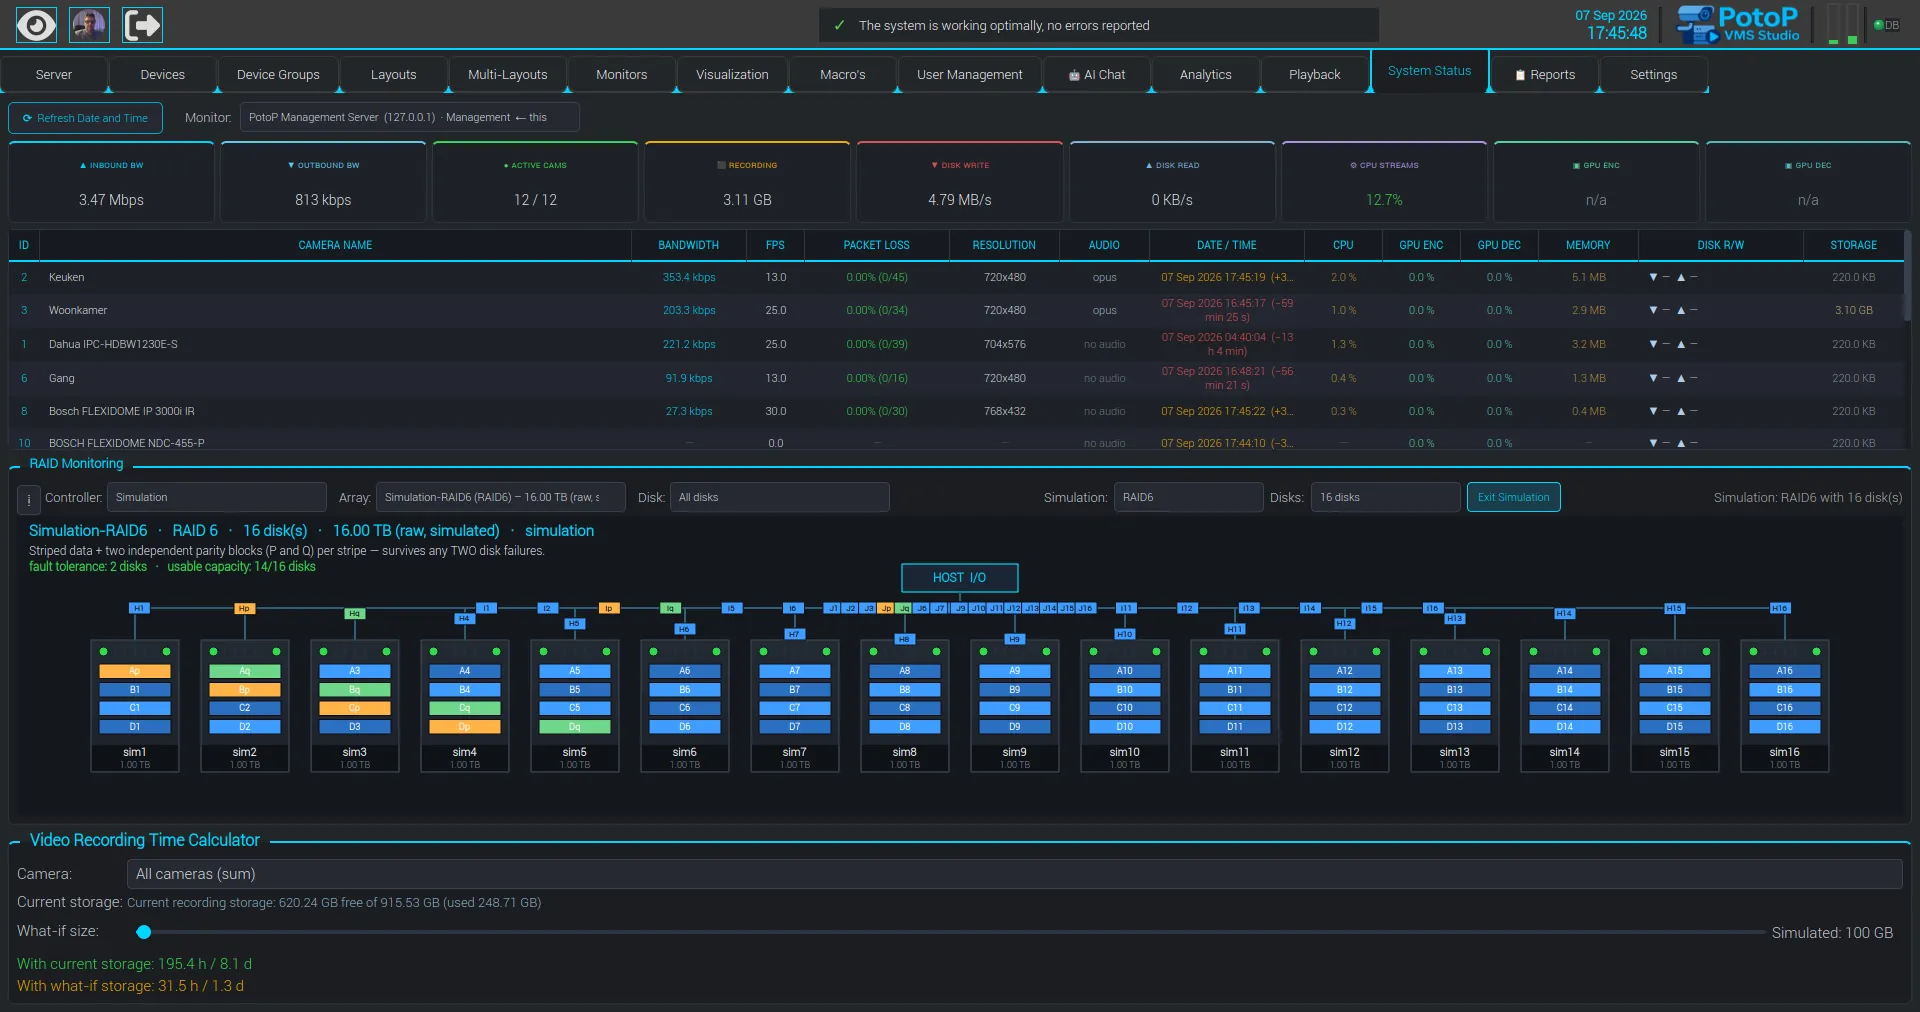
Storage health in System Status
Highlight Desktop client

Storage health in System Status

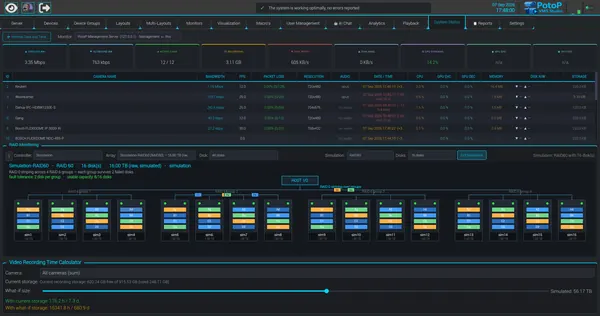
RAID monitoring sits next to live bandwidth, active cameras and recording throughput. A built-in recording time calculator turns disk capacity into hours and days of video, so operators can size retention with real numbers.

How it works

System Status polls the selected server for live figures: inbound and outbound bandwidth, active cameras, recording volume, disk read and write, and per-camera CPU, memory and storage. RAID health comes from the array controllers on that server, and this capture shows a simulated array. The recording time calculator divides the free recording space, or a what-if size set with the slider, by the measured bitrate of the cameras. It gives hours and days of retention from real stream data rather than from an estimate typed in by hand.

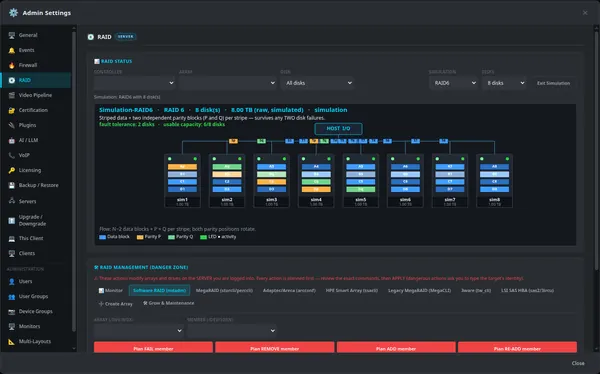
RAID layouts you can see
Server web admin

RAID layouts you can see

The RAID panel in the admin settings draws every disk and stripe, with data blocks and both parity positions colour-coded. This simulated RAID 6 example shows two-disk fault tolerance and usable capacity at a glance, so installers can plan storage before touching a real array.

How it works

The RAID panel in the server admin settings is a drawing engine that lays out disks, stripes and parity for the chosen level. In simulation mode you pick a level and disk count and it renders a synthetic array, so nothing real is touched. On a live server the same view is filled from the actual controller: software RAID through mdadm, or hardware controllers through their vendor command-line tools. Fault tolerance and usable capacity are calculated from the level and disk count, and the diagram shows how parity rotates across members, so installers can plan before building an array.

Nested RAID 60 across groups
Desktop client

Nested RAID 60 across groups

RAID 60 stripes over several RAID 6 groups, and the diagram shows how each group tolerates its own disk failures. The calculator underneath translates the resulting capacity into recording time.

How it works

The same RAID monitor can draw nested levels. Here a simulated RAID 60 of sixteen disks is shown as four RAID 6 groups, with striping across the groups on top. The panel works out fault tolerance per group, so each group survives two failed disks, and usable capacity as eight of sixteen disks. The what-if slider below feeds that capacity into the recording time calculator, which divides it by the measured camera bitrate. Planning is done on the server data without changing any disks.

Create arrays from the client
Desktop client

Create arrays from the client

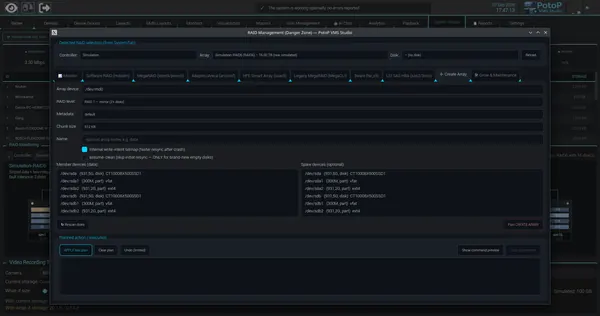
Build a software RAID array by choosing device, level, chunk size and members from the detected disks. Every step is planned first and shown as a command preview, so nothing changes until you confirm.

How it works

The RAID Management dialog runs in the desktop client but acts on the server you are logged into. An administrator re-enters their password to obtain a short-lived admin token. Creating an array builds a plan: the server lists detected disks and prepares the exact command as an argument list, never a shell string, and shows it as a preview. Nothing runs at plan time. Apply executes only that stored plan through a fixed allowlist of RAID tools, and dangerous actions ask you to type the target's identity first. Software RAID uses mdadm.
Grow, reshape and maintain
Desktop client

Grow, reshape and maintain

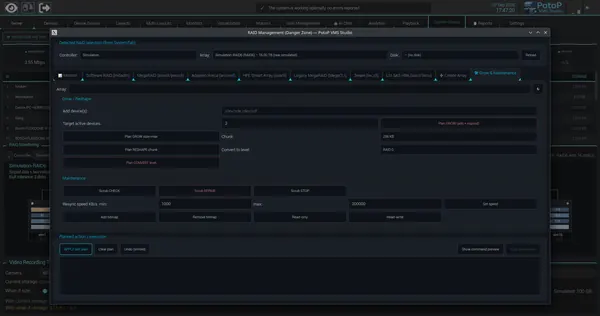
Add disks, expand an array, change chunk size or convert level, and run scrub checks and repairs. Resync speed limits let you balance maintenance against recording load.

How it works

Grow and maintenance actions follow the same plan-then-apply flow as array creation. The client sends the request, the server validates every device name and builds the exact mdadm command for adding disks, expanding, changing chunk size or converting level, and returns it for review. Scrub check and repair start the kernel's consistency scan on the array. Minimum and maximum resync speed are the standard Linux software RAID limits, so a rebuild can be slowed while cameras are recording. Applying needs the admin token and, for risky steps, identity confirmation.
12

Failover & redundancy 5 screens

A standby server mirrors the primary and takes over by itself when the primary goes down.

Live and standby, side by side
Highlight Desktop client

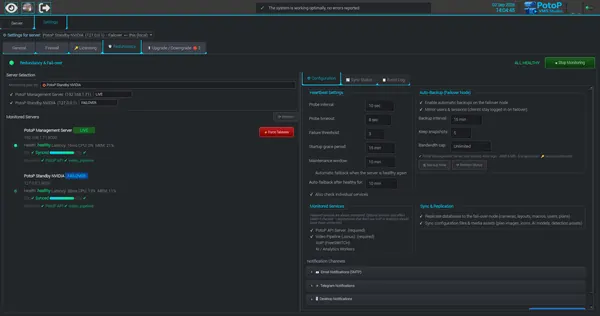
Live and standby, side by side

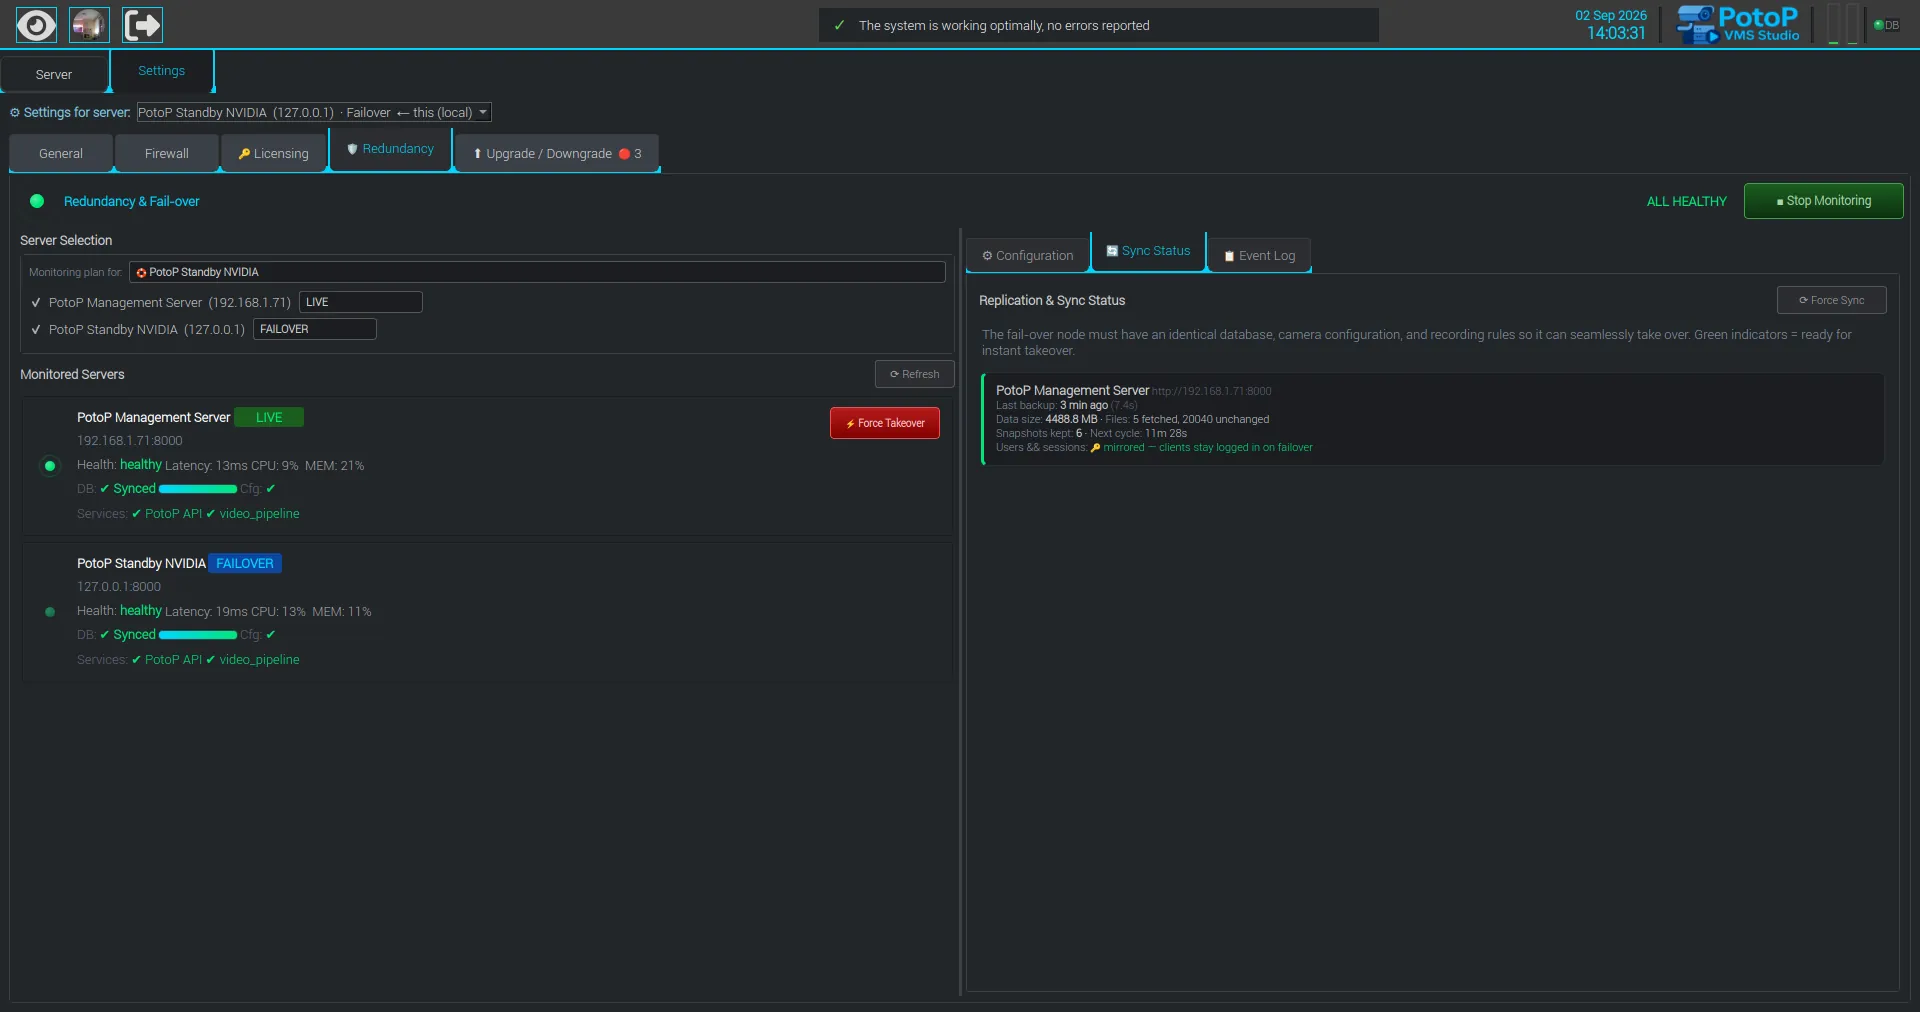
The Redundancy tab shows the live server and its failover node with health, latency, CPU and memory. Database and configuration sync status is shown per server, and user sessions are mirrored so clients stay logged in. Force Takeover is available from the same tab.

How it works

The Redundancy tab shows a management server and a failover node monitored by a heartbeat. Health, latency, CPU and memory come from probes of each server's API, and video pipeline status is checked as well. A replication agent on the failover node periodically pulls a full export of database and configuration from the live server. Only files whose checksum changed cross the network. Users and sessions are mirrored into the standby's own database, so existing login tokens stay valid there and clients remain signed in after a takeover.

Tune detection and backups
Desktop client

Tune detection and backups

Set probe interval, timeout and failure threshold, and choose which services are monitored. Automatic backups, snapshot retention and a bandwidth cap control how the standby node stays in step, with optional e-mail, Telegram and desktop alerts.

How it works

The Configuration tab sets how failure is detected and how the standby stays current. The monitor probes each server at the probe interval, and a server is declared failed only after the configured number of consecutive failed probes. Required services are always monitored, while optional ones such as VoIP or analytics only count if ticked. Backup interval, number of snapshots kept and a bandwidth cap control the replication agent on the failover node. Alerts can go out by e-mail (SMTP), Telegram or desktop notification.

Replication running
Desktop client

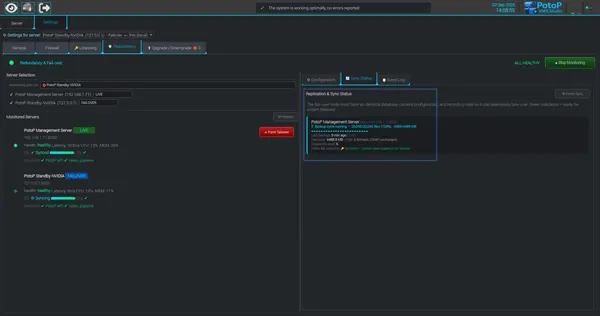
Replication running

A backup cycle reports files and megabytes transferred while the standby shows its database as syncing. You can see at any moment how close the failover node is to the live server.

How it works

During a backup cycle the failover node requests a manifest of the live server's files and databases, then fetches only what changed since the previous snapshot. Unchanged files are linked from the previous copy, which is why the panel can show thousands of files with only a handful fetched. Progress in files and megabytes is written to a status record that the client shows live. The finished export is rotated into a snapshot folder, and the standby's database line reads Syncing while data is being applied.

Failover active, one click back
Desktop client

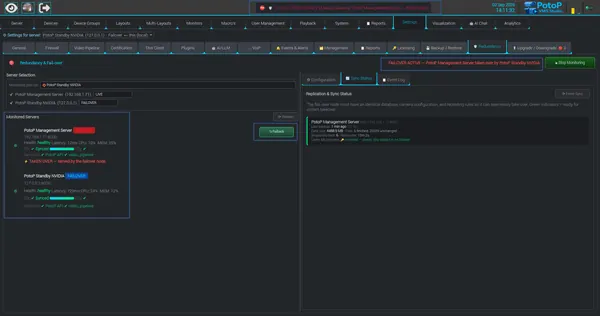
Failover active, one click back

When a server is taken over, the banner turns red, the live server is marked offline and its cameras are served by the failover node. A single Failback button returns the work when the original server is healthy again.

How it works

A takeover happens automatically when the failure threshold is reached, or manually with Force Takeover. The standby then serves the failed server's cameras, the failed server is marked offline, and the banner and top status line turn red. When the original server answers its probes again, Failback moves the cameras home. The Configuration tab can also do this automatically after the server has been healthy for a set number of minutes. Clients keep working because users and sessions were already mirrored to the standby.

A clear failover event log
Desktop client

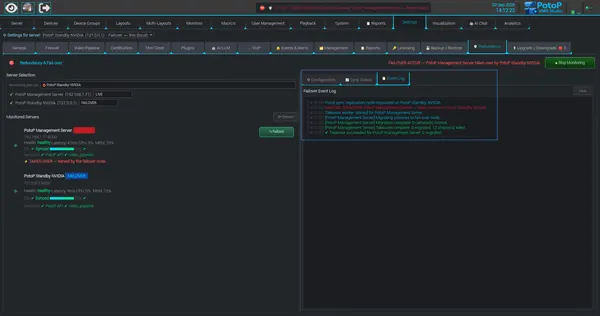
A clear failover event log

Every step of a takeover is logged with a timestamp: replication, camera migration, streams stopped and the final result. The record helps operators verify what happened and document it afterwards.

How it works

The Event Log tab records each step of the redundancy process as it happens, with a local time stamp: a forced replication cycle, the takeover request, the start of the takeover worker, camera migration, the number of streams stopped on the failed server and the final result. The entries come from the server's takeover sequence and are kept for the session, with a Clear button. Because every transition is written in order, an operator can check afterwards what the system did and copy it into an incident report.

13

AI training studio 5 screens

Teach the system your own objects: annotate, train, convert and deploy models without leaving PotoP.

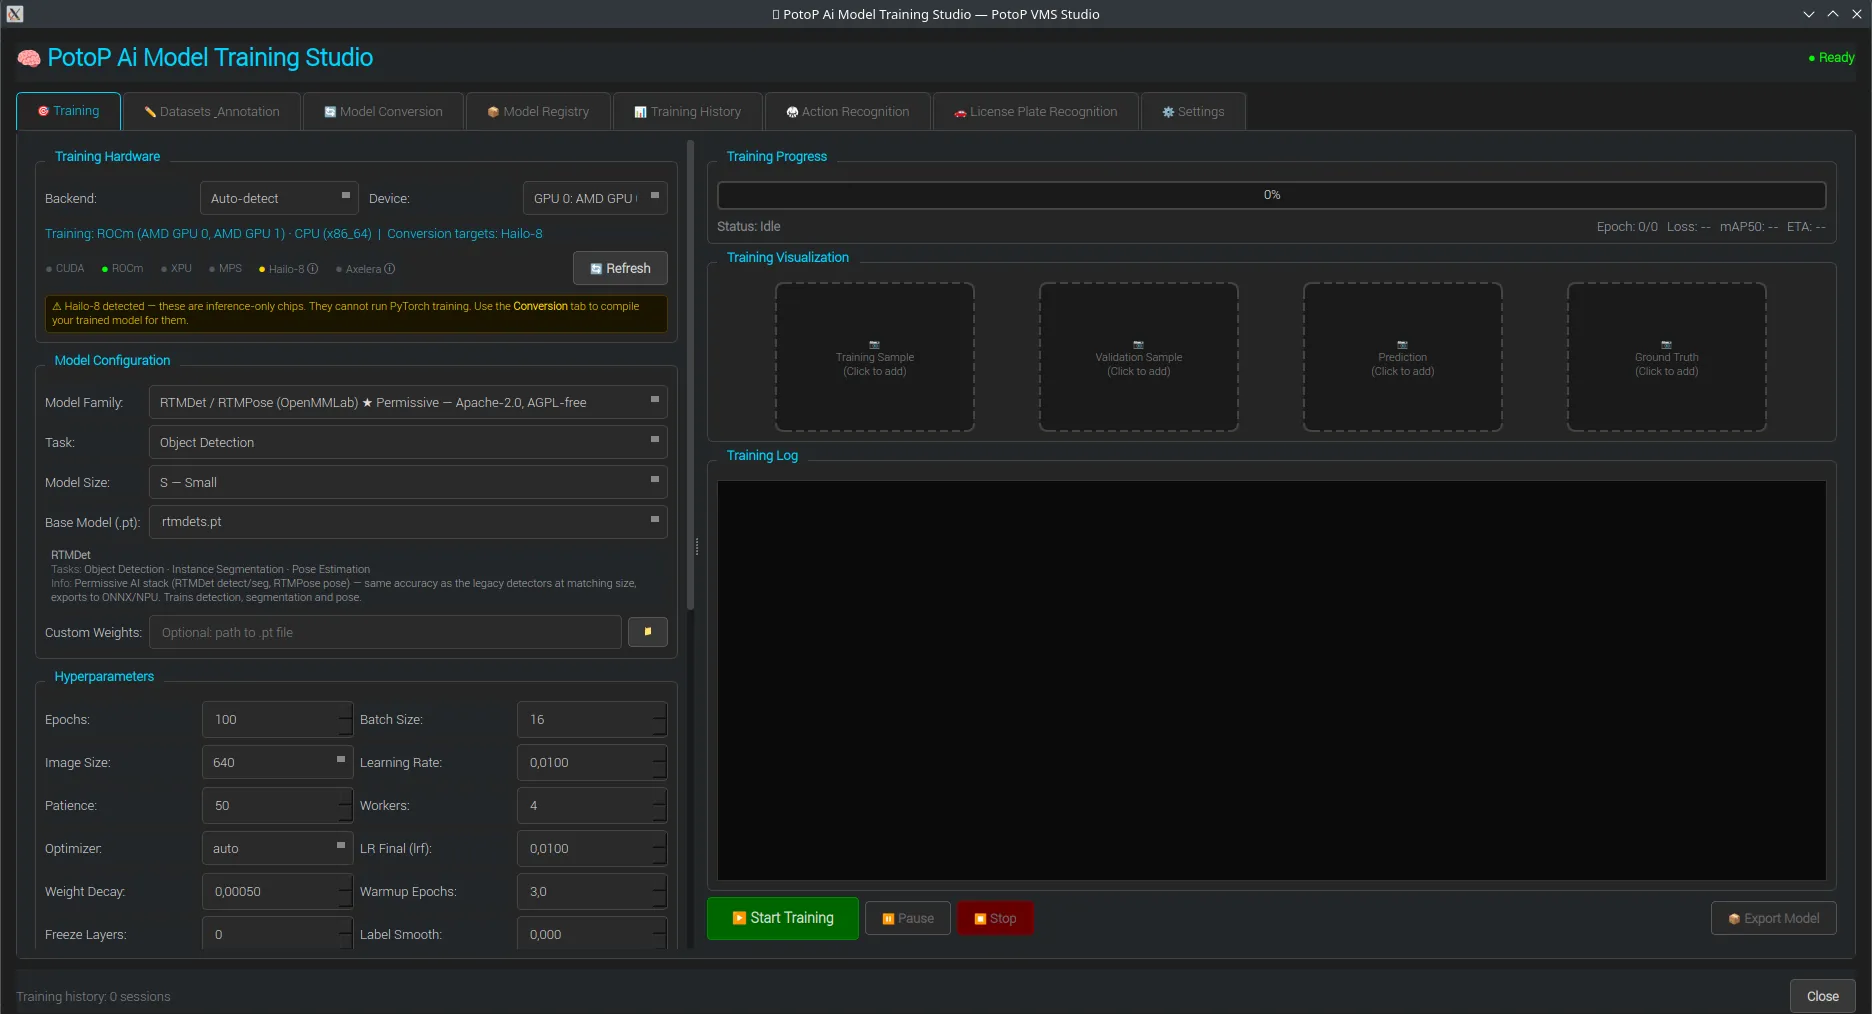
Train your own detection models
Highlight Training studio

Train your own detection models

Pick a model family, task and size, then set epochs, image size and hyperparameters. The studio detects the available training hardware and shows progress, samples and a live log while a model trains.

How it works

The Training Studio is a separate window of the desktop client. It scans the machine for training hardware such as NVIDIA CUDA or AMD ROCm GPUs and the CPU, and marks inference-only chips like Hailo-8 as conversion targets. You choose a model family, task and size, then hyperparameters. Training runs as a background job with PyTorch-based trainers on the chosen device, streaming epoch, loss, mAP and a live log into the window. Permissive model families are marked, which matters for commercial licensing.

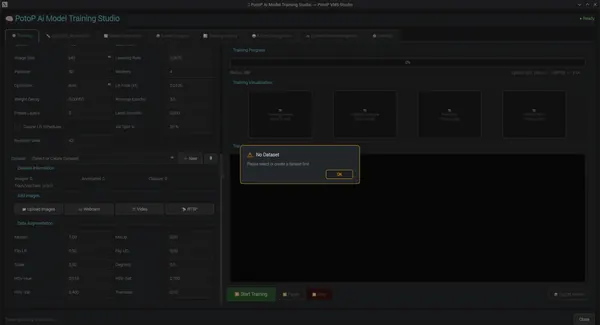
Datasets and augmentation for training
Training studio

Datasets and augmentation for training

Below the hyperparameters, the Training tab collects images from uploads, a webcam, video or RTSP, and applies augmentation such as mosaic, flips, scale and colour shifts. A dataset must be selected before training can start.

How it works

The Training tab holds the dataset, augmentation and image-source controls that feed a training run. A dataset is a folder of images with labels, filled from uploaded files, a webcam, a video file or an RTSP stream. Augmentation settings such as mosaic, flips, scale, rotation and colour shifts are applied on the fly while training. Validation split and random seed keep runs reproducible. The dialog shown appears when Start Training is pressed with no dataset selected. Conversion to ONNX and accelerator formats is a separate tab.

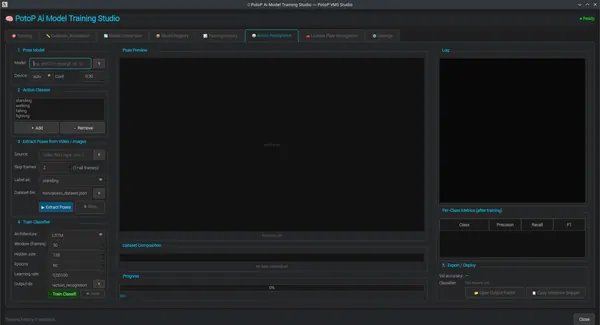
Action recognition from poses
Training studio

Action recognition from poses

Extract poses from video, label them with action classes such as standing, walking, falling and fighting, and train a classifier. Per-class precision, recall and F1 are reported after training.

How it works

Action recognition works in two stages. First a pose model runs over your video or images and extracts body keypoints for each person, saved with the label you choose, such as walking or falling. Then a small sequence classifier, an LSTM by default, is trained on windows of consecutive frames of those keypoints, using PyTorch on the selected device. After training, precision, recall and F1 are calculated per class on held-out validation data. The result can be exported with an inference snippet for use in analytics.

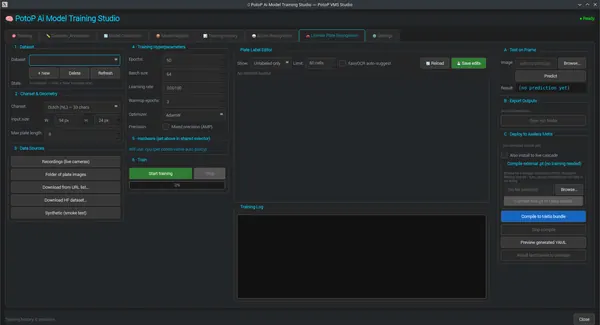
License plate recognition training
Training studio

License plate recognition training

Train a plate reader for a chosen country charset from live recordings, image folders or public datasets. A plate label editor, a test-on-frame tool and export to accelerator bundles complete the workflow.

How it works

The plate tab trains a character-sequence recognition network of the LPRNet type, which reads a cropped plate image and decodes characters with CTC. You pick a country charset and input size, then collect plate crops from recordings, image folders, URL lists or public datasets. The label editor lets you correct unlabeled plates, with optional OCR suggestions. Test on Frame runs the current model on one image. Finished models are exported, and can be compiled into a bundle for Axelera Metis accelerators and installed into the live recognition cascade.

Annotate datasets in the client
Training studio

Annotate datasets in the client

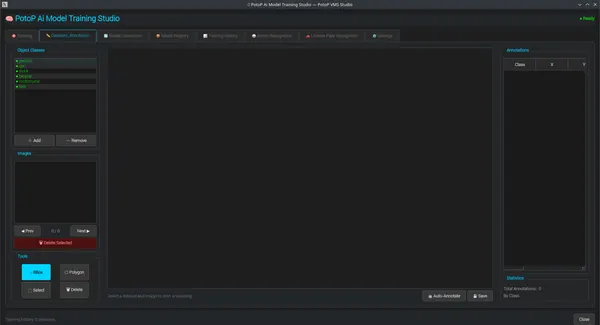
Draw boxes or polygons over your own images, manage object classes and let auto-annotate propose labels. Annotation statistics show how well each class is covered.

How it works

The annotation tab is a labelling tool inside the Training Studio. You define object classes, browse the dataset's images and draw bounding boxes or polygons with the mouse. Each annotation is stored with its class and coordinates in the dataset folder, in the format the trainers read. Auto-Annotate runs an existing detection model over the image and proposes labels for you to accept or fix. The statistics panel counts total annotations and boxes per class, so you can see which classes lack examples.

14

AI assistant 5 screens

Ask your installation questions in plain language and let the assistant prepare the change for you.

Ask your system in plain language
Highlight Web client

Ask your system in plain language

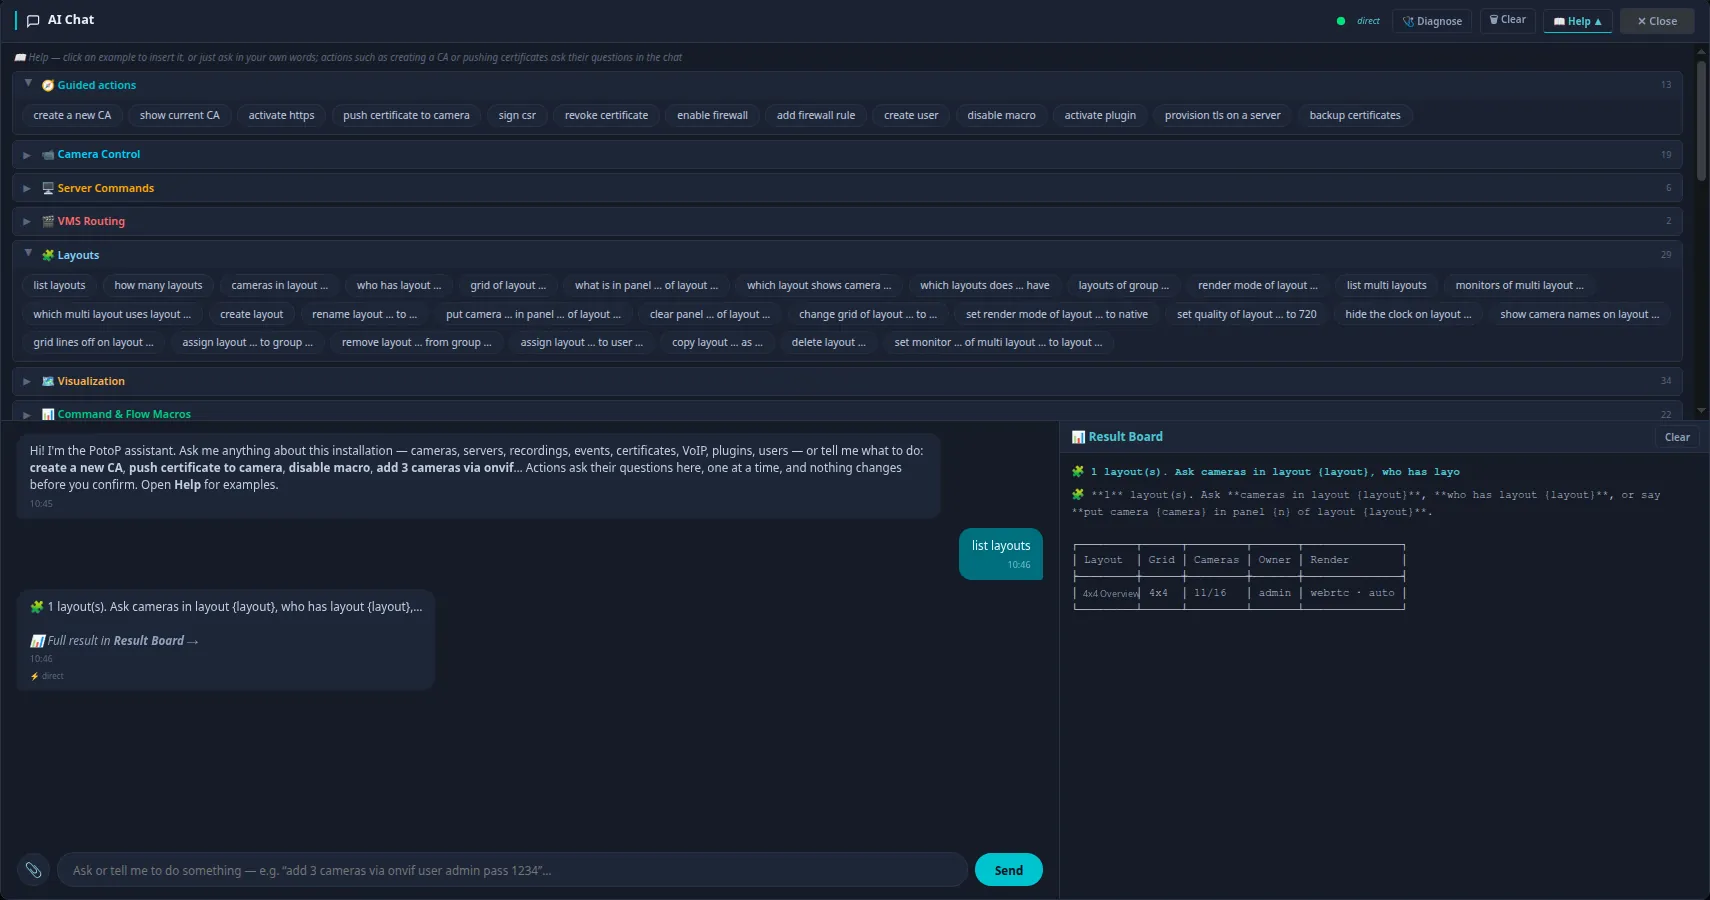
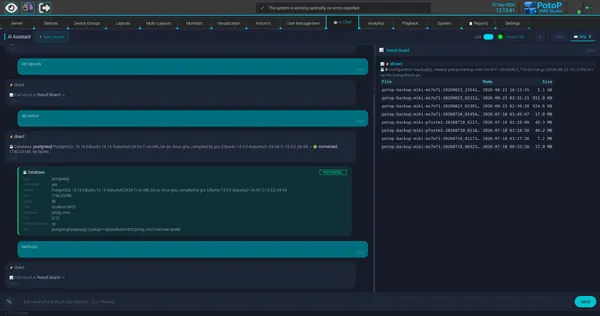
The AI chat offers guided actions for layouts, cameras, servers, certificates, firewall, users and macros. Click an example or type your own request, and results appear on a separate Result Board.

How it works

The AI Chat is built into the web client and the desktop client. Most requests are understood by a rule-based command engine on the server, marked direct in the chat, which maps phrases like list layouts to the same functions the user interface calls. The Help panel lists example phrases per topic. Actions that change things, such as creating a CA or pushing certificates, ask their questions step by step and change nothing until you confirm. Large answers go to the Result Board so the conversation stays readable.

Instant inventory answers
Web client

Instant inventory answers

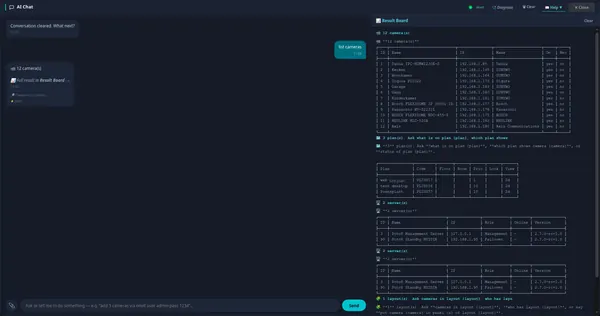
Type 'list cameras' and the assistant returns a table with names, addresses, makes and recording state. The same works for plans, servers, layouts and macros, without navigating through menus.

How it works

Inventory questions are answered directly from the server's database, without a language model. Typing list cameras runs a lookup on the server and returns names, IP addresses, manufacturers and whether the camera is on and recording, drawn as a text table in the Result Board. The same engine covers plans, servers, layouts and macros. The chat only presents the result, so the answer reflects the live configuration, and it respects the permissions of the signed-in user.

Guided follow-up questions
Desktop client

Guided follow-up questions

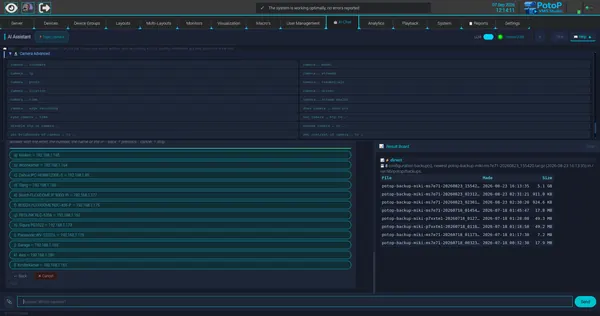
When a request needs more detail, the assistant lists the choices as a lettered picker, such as which camera to inspect. You can answer with the letter, name or IP address, and Back and Cancel keep the conversation under control.

How it works

Requests that lack a detail, such as a camera advanced query, start a short dialog on the server. The assistant lists the valid choices from the current configuration, here every camera with its address, and waits for the answer. You can answer with the letter, the name or the IP address. Back returns to the previous question and Cancel ends the dialog. The picker is generated from live data, so it only offers cameras that exist.

Diagnostics and backups in chat
Desktop client

Diagnostics and backups in chat

Ask for database status or backups and get server health, version and configuration backups with dates and sizes. Local language model support is switched on with a single toggle.

How it works

Database and backup questions are answered by direct server functions. The db status command reads the live PostgreSQL connection and reports type, version, size, table count, connection pool and host, with the password masked. The backups command lists the configuration backups stored on the server with date and size. The LLM switch enables an optional language model that runs locally through Ollama, so free-form questions can be handled without sending data to a cloud service.

Choose how much detail you see
Desktop client

Choose how much detail you see

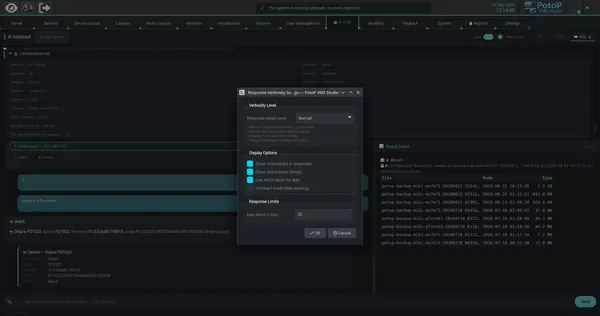
Response verbosity ranges from minimal counts to full debug output. Timestamps, icons, ASCII tables and list limits can be tuned to suit a control room or an installer at a laptop.

How it works

The verbosity dialog changes how the chat formats server answers. The four levels range from single-line counts to full output including raw values. Timestamps, status icons and ASCII tables can be switched on or off, along with a compact spacing mode and a limit on items shown in lists. The settings apply on the client when replies are rendered, so different operators can use different levels against the same server. The panel behind the dialog is the categorised help list of example commands.

Under the hood

How PotoP VMS Studio is built, where it runs and how it keeps your data safe.

01

Python server, open stack

The server is a Python FastAPI application running on PotoP OS (Linux). It manages cameras, users, recordings and settings over a REST and WebSocket API. Settings live in PostgreSQL, or SQLite for small sites.

02

Camera to screen pipeline

Cameras connect through ONVIF and RTSP, with drivers for many brands. Janus and GStreamer turn streams into WebRTC for browsers, while FFmpeg handles transcoding and export. The desktop client decodes with GStreamer, using the GPU where available.

03

Multi-vendor AI inference

AI runs server-side in worker processes as a cascade of detectors, trackers and classifiers. Backends include ONNX Runtime, OpenVINO, TensorRT and ROCm, plus edge accelerators such as Hailo and Coral. Stages can be placed on different servers.

04

Desktop, web and phone

The desktop client is Qt with PySide6. The web client runs in any modern browser and needs no install. The Android app wraps the web client with fingerprint sign-in. All use the same server API and permissions.

05

Recording and storage

Video is written as time-stamped segments, with continuous, scheduled or event-triggered rules and pre-event buffers. Segments can be encrypted with AES-256 and are pruned by age or size. Detections and thumbnails go to a separate analytics database.

06

Security by default

Access uses signed tokens with per-user and per-group rights and optional two-factor sign-in. The server has its own certificate authority for HTTPS, a built-in firewall page and an audit trail. Camera passwords are stored encrypted, and exports are password protected.

07

Redundancy and failover

A failover server pulls regular backups of the main server and mirrors its users, so existing sessions keep working after a takeover. Background jobs use database leader election, so only one instance runs them. PostgreSQL supports multiple instances.

Want to see PotoP VMS Studio on your own site?

Tell us about your installation — we are happy to show you around or set up a trial.